What All The Recession Talk Really Means

If you’ve been following along here over the past year, I won’t have to remind you that I have no problem telling it just like it is. And that includes the good news, and the bad news, about Bitcoin (BTC), cryptocurrencies in general, stocks, and the economy. You name it, and I try to be upfront and transparent.

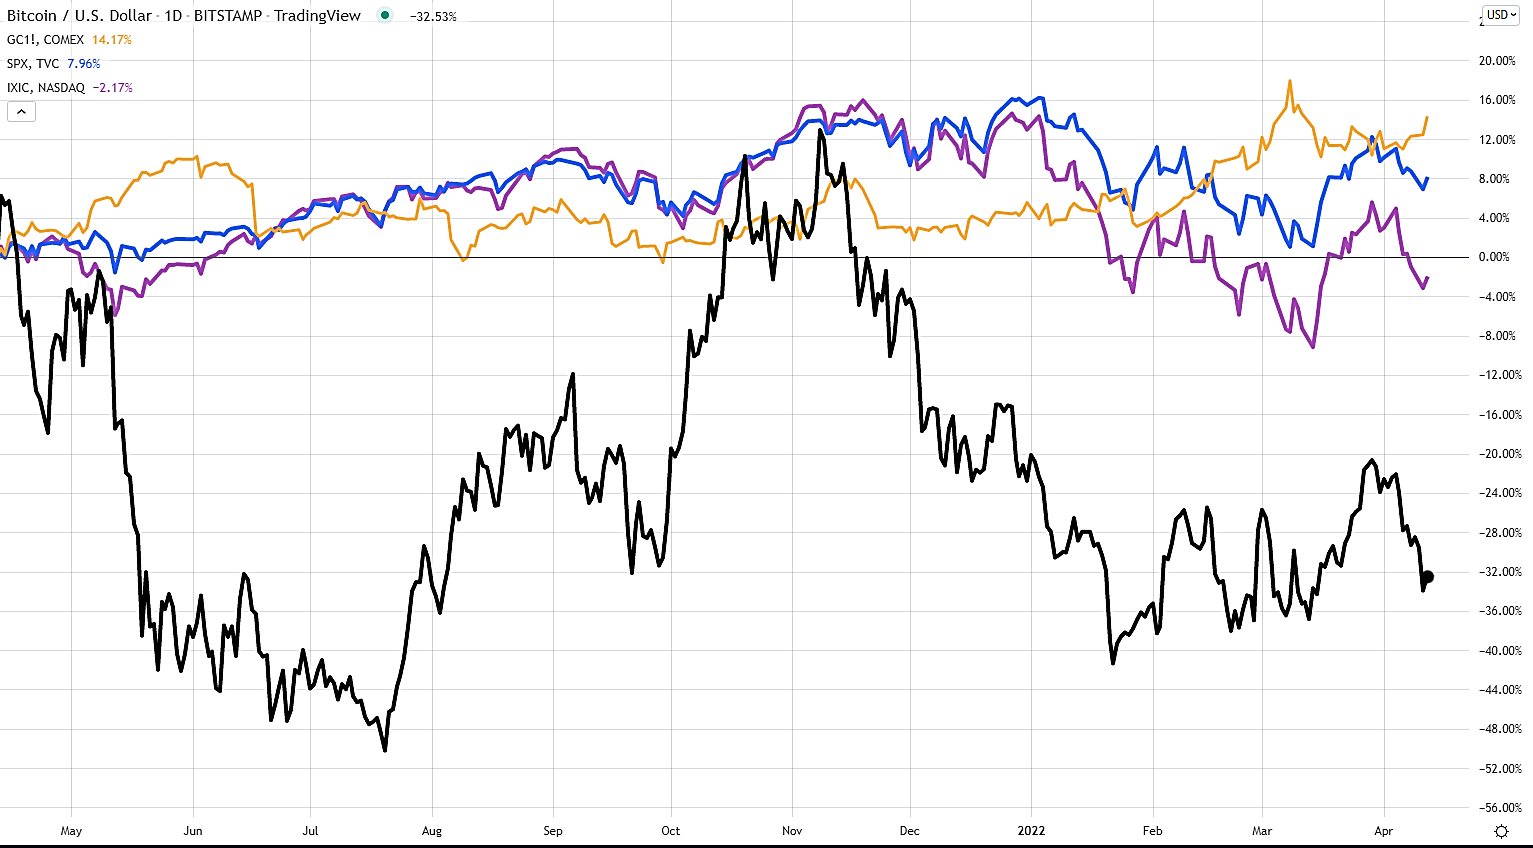
In fact, in last week’s post, I gave you the grisly details behind the sell-off in just about every asset class. I showed you how much every major stock index was down for the year in gory detail. I then showed you how Bitcoin was a member of that dubious club.

I also got under the hood of what I consider to be the biggest factor right now, which is hammering stocks and Bitcoin: Inflation.

The fact is inflation is at nosebleed levels, and it’s got just about everyone in a tizzy. And with good reason: Inflation eats away at incomes and makes products and services super-expensive. And since inflation now stands at multiple decade highs, you ignore it only at your own peril.

But as bad as inflation is, I have to remind you that down deep, what really makes investors nervous is not inflation itself but the tool of choice that gets used to fight it: Higher interest rates. Continue reading "What All The Recession Talk Really Means"

Here's Why Stocks And Bitcoin Are Down

First off, I don’t have to tell you that if you've invested in the stock market, the last couple of months has been downright terrible.

In fact, since the beginning of the year, major stock indexes of every ilk are down. Take a look:

Stocks and Bitcoin

Source

As you can see from this chart, just about everywhere you turn, stocks are getting hammered. Since the beginning of the year, the S&P 500, a good proxy for the broader stock market, is down 16%, the Dow 30 is down 11%, and the tech-heavy NASDAQ is down a whopping 26%. No matter how you slice it, that’s awful. Continue reading "Here's Why Stocks And Bitcoin Are Down"

Crypto Apocalypse?

Ethereum (ETHUSDBIT) has an annihilation pattern in its chart and I would like to share it with you below as the price of the second largest crypto is approaching the trigger point.

Crypto - Ethereum Chart

You know this famous pattern very well as this model frequently appears in different instruments. I know it looks a little bit weird as the shoulders are not symmetric. However, all parts are in place, and the Head is the highest peak.

The failure to proceed to the upside after breakout beyond this February’s peak of $3,280 dried the demand for the second largest cryptocurrency; it has been building the small Right Shoulder of the pattern. The Neckline has been drawn through the valleys of the Head. Continue reading "Crypto Apocalypse?"

Bitcoin Still Shines Like A Sun

In this post, I would like to show you what happens to the structure of the crypto market over time as new stars join the universe with hopes of taking down the shining star, Bitcoin.

Chart 1. Market Cap Comparison: Bitcoin, Ethereum, and Altcoins

Bitcoin vs. Ethereum

The chart above starts in September of 2017. Both altcoins and Ethereum had a market cap of around $30 billion, while the main coin had more than double that at $72 billion. The latter started to rally at once, reaching the top of $231 billion by the end of 2017. Altcoins followed Bitcoin with a delay of one month; however, the growth was more robust and the market cap caught up with that of the main coin rising more than seven-fold. It was that very rare moment when the market cap of altcoins could touch the “Sun” of Bitcoin in the considered period. Continue reading "Bitcoin Still Shines Like A Sun"

Bitcoin Tested By Uncertainty... And Wins!

I probably don’t have to tell you that no matter where you turn these days, there’s one thing you can be certain of.

Uncertainty.

That’s right. There’s a ton of uncertainty no matter where we turn. And that’s true, as a matter of fact, in our daily lives: While we try to make things as predictable and certain as possible, in the end, we’re all just flat-out exposed to uncertainty.

It’s also true when it comes to our investments in gold (GC1), stocks (SPX), tech (NASDAQ), and Bitcoin (BTC). In fact, that uncertainty is even more at play. See for yourself.

Bitcoin Daily Chart

As you can see from this chart of gold, stocks, and tech, every asset has had its fair share of volatility over the past year. In fact, the performance of gold, stocks, and tech have ranged from 18% to the upside (gold) to -9% to the downside (tech) during the last one-year performance period. Lumping all those assets together, that’s a net swing of 27% from top to bottom. Whew!
But when you throw Bitcoin into the mix, it’s clear that BTC makes that uncertainty look like a walk in the park. Why? Because over the same one-year performance period, Bitcoin has ranged from 13% to the upside (Nov 2021) to -50% to the downside (July 2021). That’s a net swing of 63% from top to bottom or about 2.3 times the performance volatility of gold, stocks, and tech. Continue reading "Bitcoin Tested By Uncertainty... And Wins!"