We have had a very good run in the stock of Netflix (NASDAQ:NFLX) and the question now is, has Netflix topped out?
 There is increasing evidence that Netflix is having problems over the $300-$310 area. With a lower close in this stock today, it will confirm that it has put in an intermediate top.
Yesterday, Netflix (NASDAQ:NFLX) put in a Japanese candlestick pattern known as "a dark cloud cover." This is confirmed as a top if the market closes lower today, September 17th. Candlestick patterns can be very powerful. This is not to say that Netflix has put in an all-time top, but rather in the interim the market has stopped going up and is probably going to see a pullback.
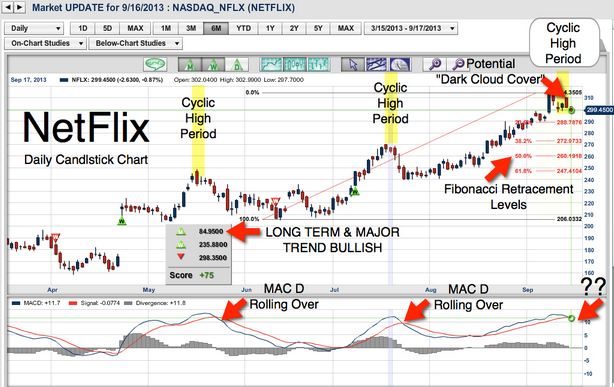
Pullbacks are always interesting and I like to use our Fibonacci retracement tool to measure them. In 2013, most of the pullbacks were in $30-$40 range. Measuring from the recent high of $314.18 on September 11th and subtracting $40, takes us down to $274 area. Coincidentally this is very close to a 50% Fibonacci retracement if we measure from the recent high on September 11th to the low seen on July 25th at $239.91.
I have two other concerns with Netflix (NASDAQ:NFLX). We are at a cyclic high and the MACD is beginning to roll over, which is similar to what happened in the May and July periods.
Please be aware I am not recommending shorting Netflix, as the longer-term trend for Netflix remains positive and I can see this market doing well longer term as it dominates the space of streaming video and home entertainment.
Let's watch today's close in Netflix very carefully. A close below the $301.13 level will represent a new 5-day low close for this stock.
This is just a heads up that Netflix may be running into some headwinds and profit taking.
Please feel free to leave a comment or your own view on the stock.
Have a great trading day,
Adam Hewison
President, INO.com
Co-Creator, MarketClub

 Adam and Jeremy are back with another episode of MarketClub TV today at 4pm EST.