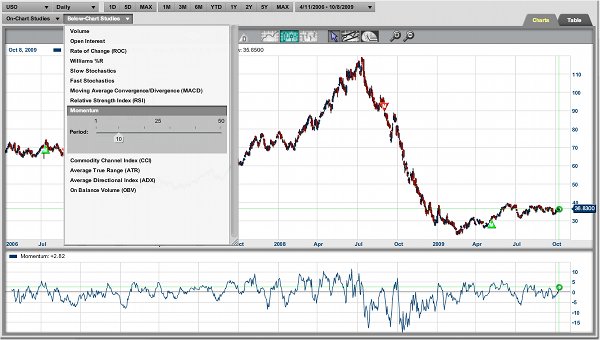
Momentum: By Definition it is Hard to Stop

Momentum:

  1. the quantity of motion of a moving body, measured as a product of its mass and velocity.
  2. the impetus and driving force gained by the development of a process or course of events.

People trying to manage trend changes are by definition fighting momentum, which feeds on an established trend with powerful force.  A premium service I use and otherwise depend upon for analysis of conventional US stocks and sectors (i.e. non-precious metals, non-resources, non-global), [XYZ Premium, name omitted due to wider publication], provided a chart yesterday showing the S&P 500’s breakout to all time highs noting "And to think there are still people calling this a cyclical bull within a long-term secular bear market!" Continue reading "Momentum: By Definition it is Hard to Stop"

Traders Toolbox: Momentum Revisited...

MarketClub is known for our "Trade Triangle" technology. However, if you have used other technical analysis indicators previously, you can use a combination of the studies and other techniques in conjunction with the "Trade Triangles" to further confirm trends.

Momentum measures the change in a commodity's price with time. M = Pc-Pn where M = momentum, Pc = current period's price and Pn = price n periods ago.

The length of time used for the prior period is a matter of personal preference and time horizon of the trader. A narrow window of less than five periods back would be short-term in nature while six to nine periods would be considered intermediate; 10 or more would be a longer time perspective. Continue reading "Traders Toolbox: Momentum Revisited..."

Traders Toolbox: Momentum Revisited...

Trader's Toolbox

At MarketClub our mission is to help you become a better trader. Our passion is creating superior trading tools to help you achieve your goals -- no matter which way the markets move -- with objective and unbiased recommendations not available from brokers.

The Trader's Toolbox posts are just another free resource from MarketClub.

---

"MarketClub is known for our “Trade Triangle” technology. However, if you have used other technical analysis indicators previously, you can use a combination of the studies and other techniques in conjunction with the “Trade Triangles” to further confirm trends.

Momentum measures the change in a commodity’s price with time. M = Pc-Pn where M = momentum, Pc = current period’s price and Pn = price n periods ago.

The length of time used for the prior period is a matter of personal preference and time horizon of the trader. A narrow window of less than five periods back would be short-term in nature while six to nine periods would be considered intermediate; 10 or more would be a longer time perspective...."

Revisit the Trader's Toolbox Post: "Momentum" here.

Momentum, Reversals, and Bar Patterns

Last week AJ Brown from TradingTrainer.com gave us a great article to 'chew on' covering OTM near-term vertical debit spreads. The response was pretty good, but I think we'll get him an even greater number of comments with this article on momentum, reversals, and bar patterns. Please enjoy the article and if you haven't done so yet, I recommend you check out AJ's training videos as you'll learn a TON!

==================================================================

Every day’s bar tells us something about what to expect the next trading day. In other words, today’s bar affects tomorrow’s bar. So how do we know what that effect will be?

Not every bar will give you clear insight into where the market is headed. But there are certain bar patterns that are more informative than others. Allow me to share a few of these bar patterns with you.
You can often determine if the next trading day is going to be an up day or a down day by looking for a “key reversal up” or a “key reversal down.”
Continue reading "Momentum, Reversals, and Bar Patterns"

Traders Toolbox: Moving Average Convergence / Divergence (MACD)

MarketClub is known for our "Trade Triangle" technology. However, if you have used other technical analysis indicators previously, you can use a combination of the studies and other techniques in conjunction with the "Trade Triangles" to further confirm trends.

Developed by Gerald Appel, this indicator consists of two lines: a solid line called the MACD line and a solid line called the signal line. The MACD line consists of two exponential moving averages, while the signal line is composed of the MACD line smoothed by another exponential moving average.

To complete the standard calculation of the two lines, you must:

  1. Calculate a 12-period exponential moving average of closing prices
  2. Calculate a 26-period exponential moving average of closing prices
  3. Plot the difference between the two calculations above as a solid line. This is your MACD line.
  4. Calculate a nine-period exponential moving average of the MACD line and plot these results as a dashed line. This is your signal line.

MarketClub will do the above calculations for you. The MACD line is represented by a red solid line and the Signal line is represented by a green solid line. The default values for this study are set to the suggest values listed above.

The most useful signals generated from this system occur when the solid red (MACD) line crosses below the green solid line (Signal) and a sell signal occurs when it crosses above the signal line.

---

You can learn more about the MACD and Gerald Appel by visiting INO TV.