MarketClub is known for our "Trade Triangle" technology. However, if you have used other technical analysis indicators previously, you can use a combination of the studies and other techniques in conjunction with the "Trade Triangles" to further confirm trends.
Developed by Gerald Appel, this indicator consists of two lines: a solid line called the MACD line and a solid line called the signal line. The MACD line consists of two exponential moving averages, while the signal line is composed of the MACD line smoothed by another exponential moving average.
To complete the standard calculation of the two lines, you must:
- Calculate a 12-period exponential moving average of closing prices
- Calculate a 26-period exponential moving average of closing prices
- Plot the difference between the two calculations above as a solid line. This is your MACD line.
- Calculate a nine-period exponential moving average of the MACD line and plot these results as a dashed line. This is your signal line.
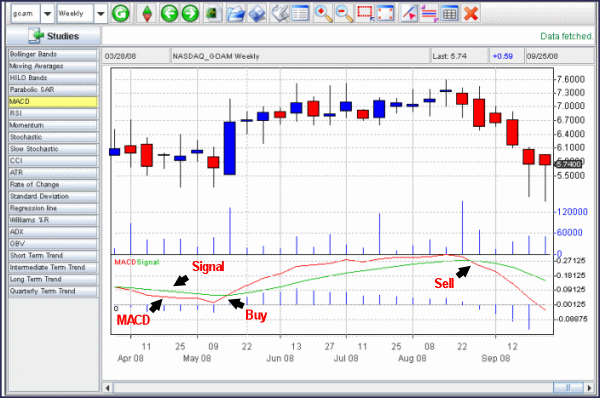
MarketClub will do the above calculations for you. The MACD line is represented by a red solid line and the Signal line is represented by a green solid line. The default values for this study are set to the suggest values listed above.
The most useful signals generated from this system occur when the solid red (MACD) line crosses below the green solid line (Signal) and a sell signal occurs when it crosses above the signal line.

---
 You can learn more about the MACD and Gerald Appel by visiting INO TV.

Okokon,
The best way to find out this information is to Google it.
Thanks for using our site.
Adam
Hello sir,
I want to say thanks for your fine indicator(MACD).
I wish to ask for the calculation of the use of MACD,
this will assist me to understand the forex market well.
Thanks,
Okokon A.
I'm always happy to hear someone likes the PSAR. However, I've never liked the default display using rows of dots. If your charting service offers HISTOGRAM- give it a test. I also lighten the shade of gray which saves ink if you want to print the chart.
Regarding
"The most useful signals generated from this system occur when the solid red (MACD) line crosses below the green solid line (Signal) and a sell signal occurs when it crosses above the signal line."
The example shows the opposite situation to the described rule.
Don
Daniel is quite correct, the description is wrong. Im amazed that this article was posted with something so elementary being wrong in it. Normally Ino's articles are pretty accurate while keeping things as simple as possible. Here they've had a double bogey IMHO -- something that's too simple (by excluding what is IMHO neccesary discussion about MACD e.g. re histogram, divergence etc.) and to boot got the most basic of descriptions wrong.
Anyway, as far as MACD is concerned, here's my 2 cents worth:
a) MACD crosses are not (by themeself) a good signal source, as they tend to lag too much.
b) This tendency was even recognized and as such another author added the "MACD histogram", which is also shown above but not mentioned. (The bars underneat the MACD.) The MACD histogram is the difference between the MACD and it's signal line. Simply put, if the MACD is loosely analogous to/an approximation of "velocity", then the MACD histogram is loosely analogous to/an approximation of "acceleration". As such, when the MACD histogram peaks/turns, it portens a turn (and eventual cross) in the MACD itself, and when it changes, it portends a turning in price itself. The MACD histogram is an earlier warning of impending turns than the MACD line itself.
c) Even so, again, by itself the MACD histogram, being effectively a 2nd derivative of price generates too many false positives, so IMHO should not be used in isolation.
d) Consequently the better (and really very powerful) use for the MACD is to spot divergences, either using the MACD line itself or sometimes the MACD histogram (but again, be careful for false positives.)
I agree with the coment made by Daniel Green. I think is the other way round......The most useful signals generated from this system occur when the solid red (MACD) line crosses below (???) OR ABOVE ...? the green solid line (Signal) and a sell signal occurs when it crosses above (???)OR BELOW ??? the signal line."
Best wishes
Mauricio
Why is the MACD line everywhere else the dark line and the red line is the signal...this presentation does not help understanding...
This is so confusing. What is correct?
As with most indicators, no one indicator is fool-proof. Since MarketClub introduced me to the MACD, I've added the Slow Stochastics, %R, 10-Day MA and PSAR and all have proven to be quite formidable when combined with Trade Triangles. I used this strategy to enter Crude, 1-day prior to Adam's most recent video.
Read this quote and then look at the graph.
"The most useful signals generated from this system occur when the solid red (MACD) line crosses below the green solid line (Signal) and a sell signal occurs when it crosses above the signal line."
A sell signal occurs when it crosses above the signal line? If the signal line is the green line then a buy signal occurs when it crosses above the signal line, NOT a sell signal. Look at the chart. Any time I read something, anywhere, about an indicator there is usually a mistake. And that is one reason why it is so difficult for some people to learn these complex things.
I think you are right. Hopefully someone will get back to you. Good catch
The complexity of indicators can be a problem for those into stats.
The rule is less rules. Is the MACD is too complex to be reliable?
Isn't it just another curve fitter?