
Today a good friend of mine John Bougearel of Financial Futures Analysis will share with us his trend strategy during 2009 Earnings Season. Take a look, then let us know how earnings affect your trading.
===================================================================
The SP500 NFP +1 Day Model for April 3: In Advance of the Q1 09 Earnings Season Model
A longstanding behavioral finance model that I use considers the release of an important announcement plus one or two days. The flipside of this is model is the release of an important announcement minus a day or two. In this instance, we are considering is the NFP +1 day model. A second perhaps more important model to address is how the pricing of the SP 500 during the Q1 09 earnings season might or might not correlate to the pricing model Q4 08 earnings model. The two are interrelated and must be considered together.
The SP500 NFP +1 Day Model for April 3
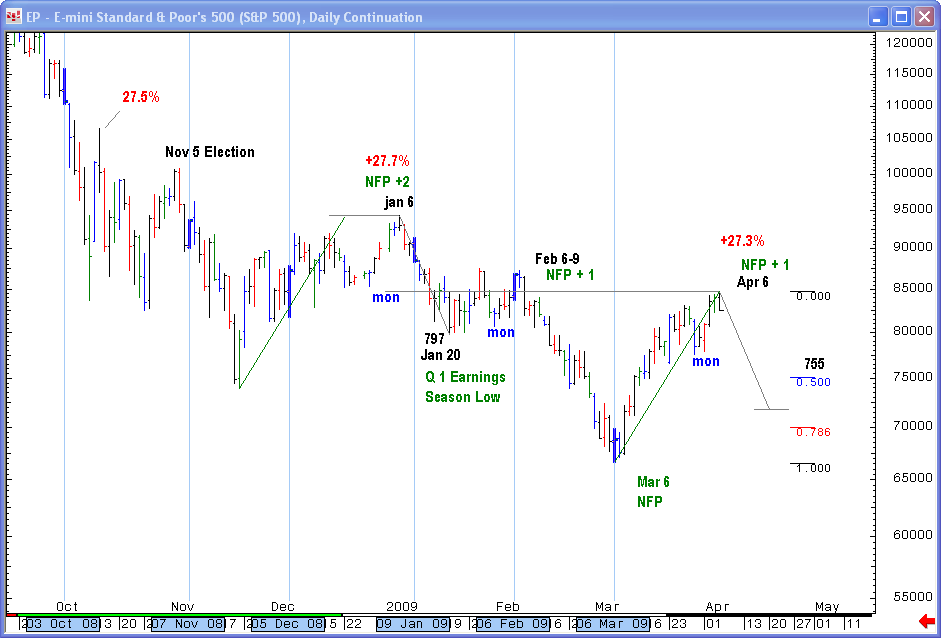
In the NFP model, we want to note there is a strong tendency for the stock market to peak or trough on or around the 6th of the month ever since the Nov 4 election. The 6th of the month coincides with NFP announcements. We also want to note that in Jan, Feb, and April, the stock market rallied all week long during the week of the NFP announcements. The NFP rally in January extended two days into the next week. The NFP rally in Feb extended one day into the next week. The NFP rally in April extended one day into next week as well. It wasn’t until the following week that the bear market resumed following the respective rallies into the Jan and Feb NFP reports! Incidentally, both the Feb 9 and April 6 highs were 4 points above Feb 6 and April 3 NFP highs ~ that was the kicker “telltale.”
And worse, technically the rally into April 6 has done nothing to change the bear trend at all. The April 6 high neither took out a prior high, and in fact, was perfectly symmetrical to the 27% rally into Jan 6 2009 ahead of the Q1 earnings season. So, if this is all that we were to consider, we would have to say, that the downside risks far exceed the upside risks near term and that the bear trend is about to resume. These correlation studies are scary stuff to be sure and imply portfolio managers should proceed with extreme caution and consider hedging their portfolios against another wicked downdraft.
However, offsetting these bearish considerations are the earnings announcements for the financial sector that will transpire next week. The earnings from the financial sector next week could make the outcome from the April 6 high not quite as bearish as the outcomes from the Jan and Feb highs. Correlation studies are intended to show how history rhymes and that is the easy part. The hard part is to discern what substantive current events have transpired that weakens correlations to the past and which may make future outcomes substantively different than the past.
Under the present scenario, we already know the results of the Q1 09 earnings season for the financials that will be substantially improved over that of Q4 08. In Q4 08, financials had to take huge writedowns. Lawmakers, eliminated the FV accounting rule on April 2, so that financials do not have to mark their toxic assets to market in Q1 09. Now, they can put any price they deem appropriate using their own “substantive judgment.” Yes, price discovery has been trampled underfoot, and this will boost financials as-reported profits by some 20% or more according to some analysts.
Even more importantly, many of the financial firms that helped create the financial mess we are in are going to enjoy a one-time taxpayer funded windfall from AIG this quarter. In mid-March, AIG admitted roughly $50 billion in taxpayer dollars went to Goldman Sachs, Merrill Lynch, Bank of America, Wachovia and Morgan Stanley.
Goldman Sachs reports earnings on Tuesday April 14 and on Monday April 20th, Bank of America reports.
The bottom line is that these financial firms from Tuesday April 14 to Monday April 20 should buoy the SP500 as long as it stays above last weeks lows at 775 this week rather than expecting the stock market trade lower into the 20th of the month like we did during the January earnings season, we trade higher into the 20th of April.
===================================================================
John Bougearel is the author of Riding the Storm Out, a book on the effects the subprime crisis. Be sure to check him out at Financial Futures Analysis.
Darren,
I would not overthink the Ewave counts, that will do you a disservice.
email me at jb*@st*************.com and I will forward you a rough timeline of events between now and June 1 that will be of import for you to consider.
Hi, John
I think A high in commodities could occure on Martins date.
His next more important date June 13th 2011 is close to an eclipse.
The severity rating of the sun-jupitor oppostion on the 14th of Aug 2009 will be equal to that of Oct 18 1987. As well Mars will square Uranus & it will be in the Putze time window.
Steve Putze potential crash window based on eclipses. The market bottomed into in March with in this window. (the 8 biggest crashes occurred within this window)
The 8 biggest crash also occurred on the Mars- Uranus potential crash cycle (Arch Crawfords work)
A planetary station occured on the low of March 6 of 2009. Do some research & put the planetary staion dates on your charts near eclipses. The crash low of 1987 occurred on a planetary station of Jupitor & Saturn.
@ important tops the cycles will invert. (Lyndsy top) The 4 year cycle bottomed in 2002. Based on decinnial pattern rallies from the 2 will be longer then usual & can crash in Oct of the 7th year. This cycle inverted & the high came in Oct 2007.
The market decline from the 2007 highs was parabolic.( use semi log) Based on George Soros work rallies from paroblic declines are powerfull Just like the declines are from parabolic rallies.If you google you might be able to find the artical I read regarding Soros theory regarding rallies from parabolic declines.
It is verry possible that the March 6 low was point 4 on a 5 point refersal with the 2000 high being point of a broadening top.
In Elliott wave the 87 crash could have been wave 2. Wave 3 could have ended @ the 2000 high. Wave 4 could have ended @ the March 6 low in an ABC expanded flat.
This market could go up to new highs faster then it came down & crash into a low on August 8 2010.
Tom,
NFP is short for Non-Farm Payroll. Oftentimes the stock market will see important trend changes around this key date. And that has certainly been true since December.
Commodity Broker,
The stock market responsce to WFC's earnings preannouncement on Thursday was indicative of what market participants on balance should expect this week.
Hi Darren,
John Bougearel here:
Funny you should mention Sunday April 19 and Martin Armstrong. Although I will watch trading activity quite closely during this key earnings week for Financials, that is precisely the first time that I will begin to look to flatten out and short the stock market.
I would be curious to know if you are using the old Martin Armstrong dates published before he went to jail, and would like to hear any news of whether they might let Martin out of jail one day. The circumstances surrounding M.A. were most unfortunate and the world is a much impoverished as a result.
Ok. What is NFP?
Martin Armstrong has a cycle turn date on April 19
Google (Sy Harding) based on his work April 20th should be the date used for sell in May & go away.
I wouldn't mix fundamentals with technical s in this market.