
 Today's guest is Karen Stanlake of RangeTraders.com. Karen is going to tell us about the difference between trading and trending markets and some tools she uses in each market condition.
-------------------------------------------------------------------------------------------------------------------------------
Markets will either trend or trade. That is, they either move up, down, or go sideways. A common mistake is applying the wrong indicator to the wrong market condition. That would be like wearing a winter coat on a July afternoon in Phoenix!
There are some strategies that do use both types of indicators simultaneously, usually on multiple time frames. That’s beyond the scope of this article, but here are some ideas to help ensure your charts are properly attired for the market you’ve chosen to analyze.
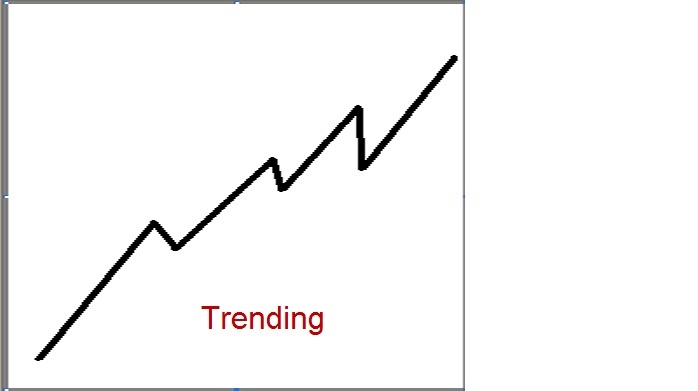
A trending market is one that prices move strongly in one direction, either up or down. The easiest way to visualize this price pattern is by drawing a line that follows the slope of the prices. Another hallmark of a trending market is the steady move to new highs and higher lows. Conversely, in a down trending market prices would be making lower lows and lower highs.
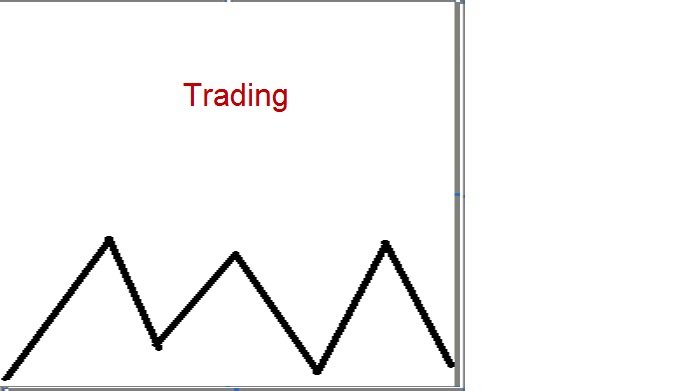
Trading markets don’t make new highs. There is no discernible strong move in either direction. Prices tend to ping back and forth near old highs and then fall to prior lows. Tracing this type of price action would reveal a series of peaks and valleys.
Most conventional thought is that there are two types of indicators – lagging and leading. In my experience, they all tend to lag. That doesn’t mean that they aren’t valuable, but knowing how to use them is key.
Indicators don’t predict – they confirm. Consequently, they should not be used in isolation, but paired with other data to validate the information on the chart. My preference is to first interpret the price pattern and then use an indicator to bolster my analysis.
Trending Markets
Trending markets require lagging indicators. Moving averages (simple, weighted, exponential) are in this category as is the MACD (that also has a leading component, too). These indicators will keep you in a trend as long as the trend remains intact. Lagging indicators are useless in a trading market -- moving averages tend to flatten in a sideways market and offer no useful information.
Here’s an idea for finding trading entries in a trending market using moving averages. Scroll back in time on your charts and plot any average. Notice how price reacts as it approaches the MA. It’s possible to build very robust trading system from this information.
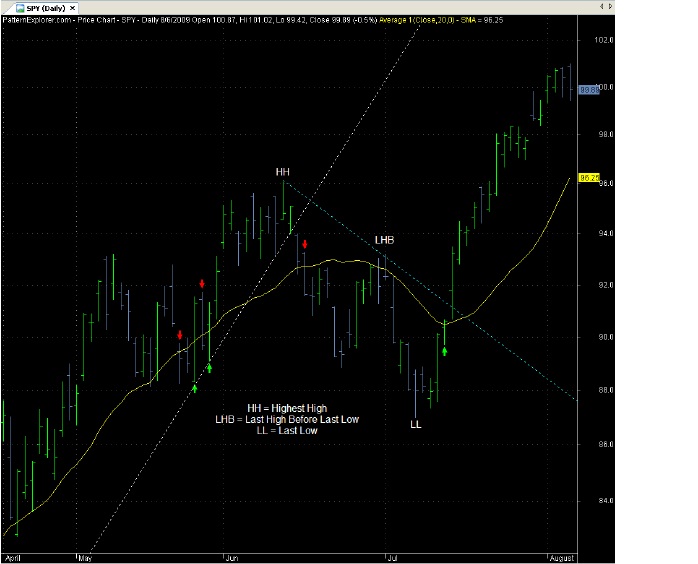
Here’s an example of price crossing a 20 period moving average. I’ve asked the software to show me closes above and closes below – those are my buy and sell signals. This is a chart of the SPY with the green arrows corresponding to buys and the red arrows as sell signals.
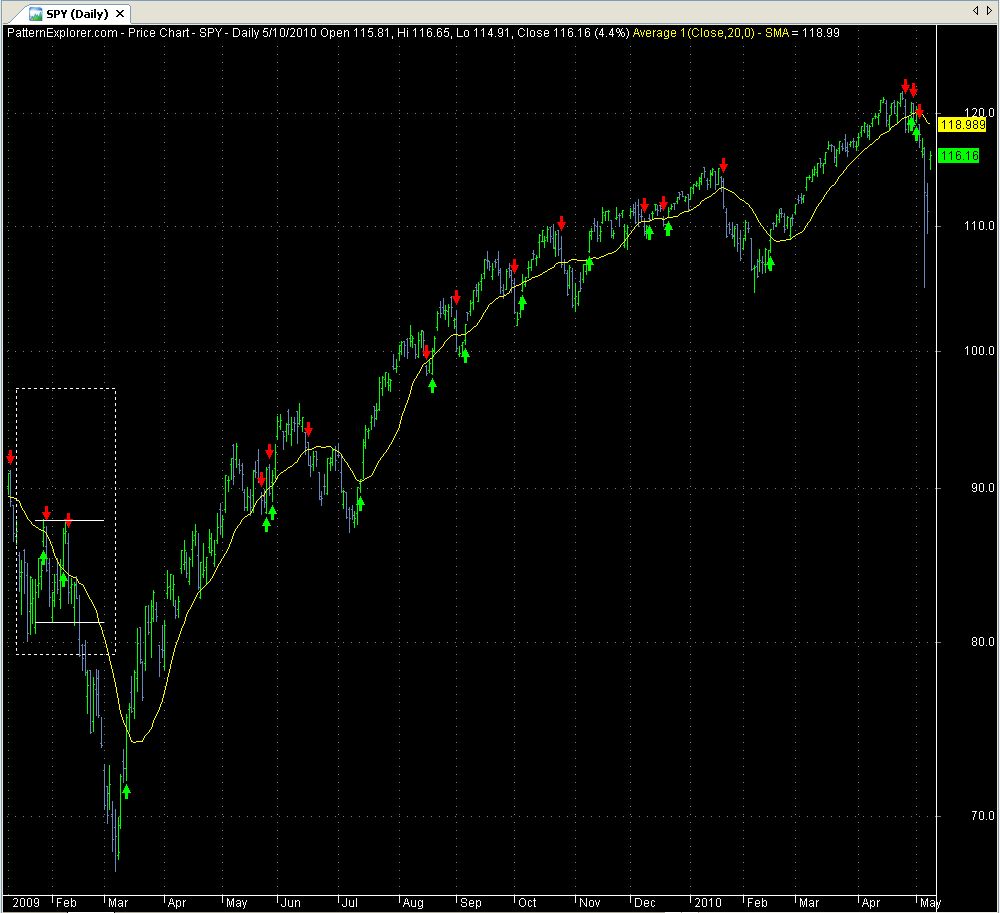
At the far left is a dotted box containing two parallel lines. The market was trading, or going sideways within that period and the severe down slope of the MA created a couple of bad signals. When a MA is so severely sloped don’t try and trade against it by going long (or short, as may be the case).
Most of the buy and sell signals from March 2009 to the present look pretty good. One way to improve this method would be drawing a trend line. That would offer additional support to a sell or buy signal.
The way I’ve drawn trend lines is a little different than others and I fail to remember where I learned this method. To draw an up trend line find the lowest low and draw the trend line up touching the last low before the last high. Here’s a close-up of the swing from March ’09 to mid June with a trend line.
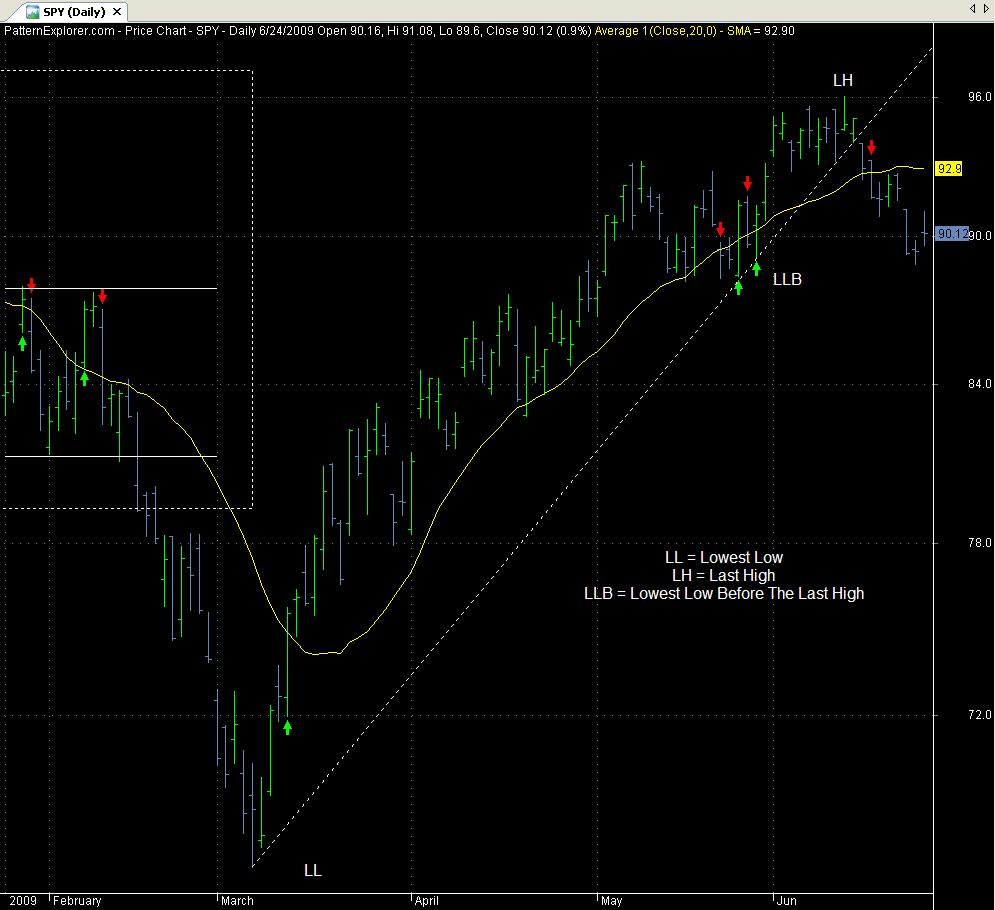
Notice how price broke the trend line, yet closed above the MA. The next bar is the sell signal bar as price closed below the 20 MA. There was advance warning when price broke below the trend line!
Once of the most profitable strategies is getting back on a trend when it resumes its former direction. One way to accomplish this is to watch price and the trend line.
Once a strong trend changes direction, plot a trend line. Strong trends usually resume their former direction and it’s important to know when to take another position.
The next chart shows that a close above the 20 MA occurred in early July as marked by the green buy arrow. The price action at the trend line suggests that the former up trend has resumed and it’s time to buy a new position.
This is how to draw a down trend line -- draw from the highest high down to the last high before the last low. I’ve drawn the down trend line in bright blue.
Trading Markets
There will always be periods of consolidation in the markets to frustrate traders. The Relative Strength Index (RSI), Stochastics Oscillator, and Williams %R are some of the common indicators in most charting software. These tools swing between oversold and overbought and are usually bounded by an upper and lower range.
Trading markets are tricky to trade. Despite the use of oscillators there will be an increased frequency of signals, both buys and sells. Many of the signals will be false and whipsaws are very possible.
One of the best ways to tame a trading market is to find the support and resistance areas on the chart. The odds of success can also be increased by taking only the most overbought and oversold signals.
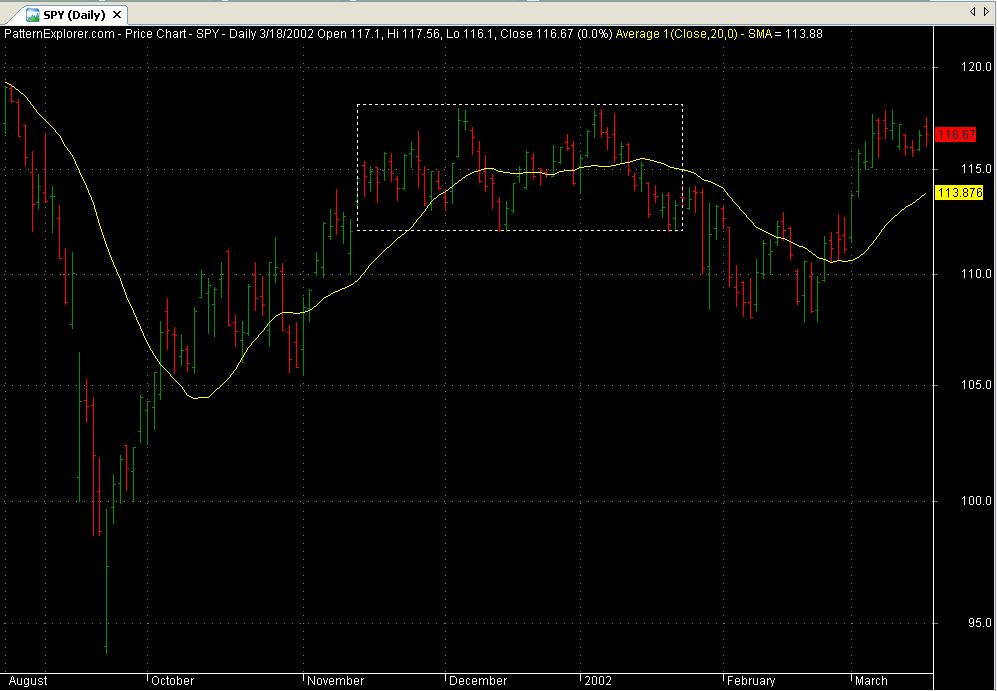
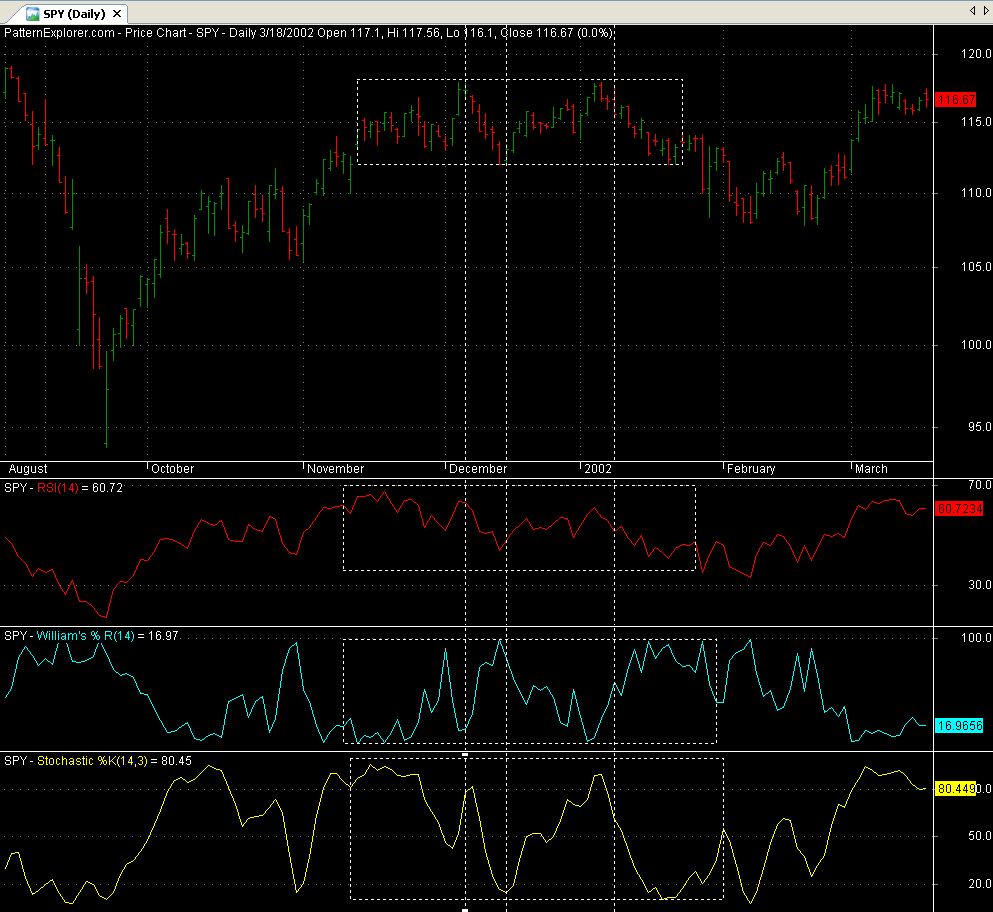
Take a look at the SPY between mid November 2001 and early January 2002 – for two months the SPY had a 6 point range swinging between 112 and 118. Notice the flatness of the MA – it provides no helpful information.
The following charts are comparisons of the following indicators during a trading market: RSI, Williams %R, and the Stochastics. First, the RSI –
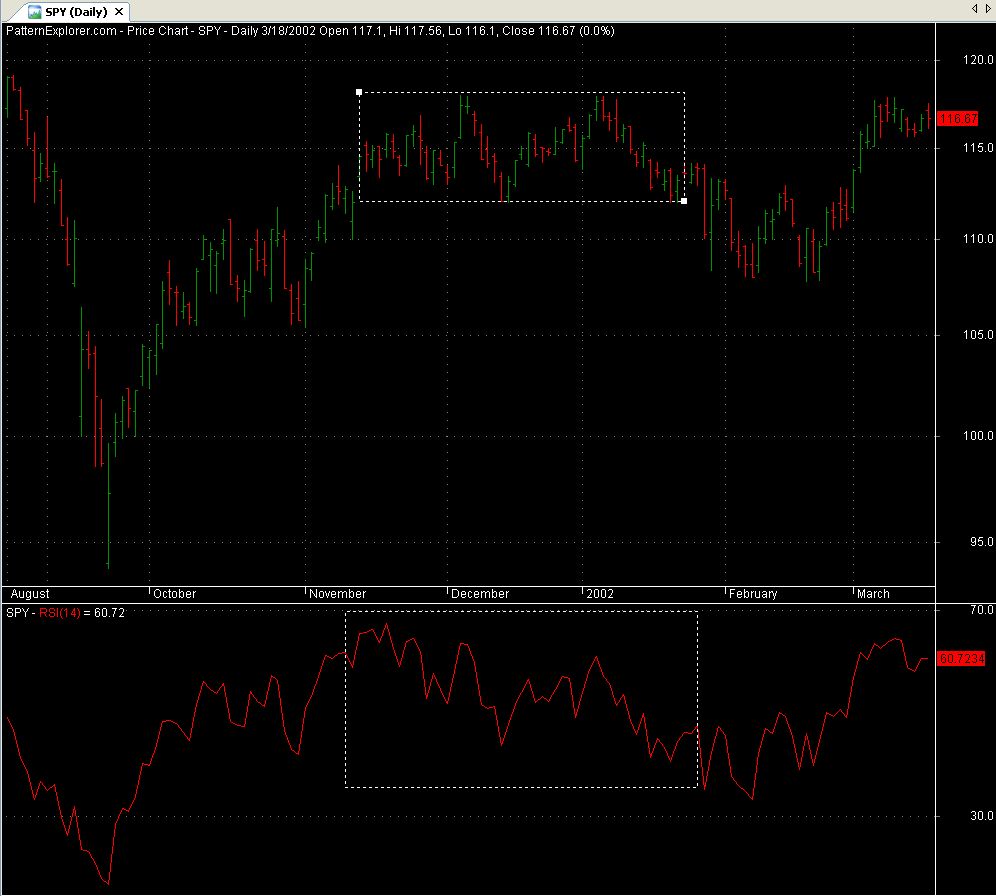
Consider the box containing price as the upper and lower limits or as areas of support and resistance. The RSI is set to the default of 14 periods and it offers little valuable information as to where to place a buy or sell. This is the same chart with the Williams %R – not much better.
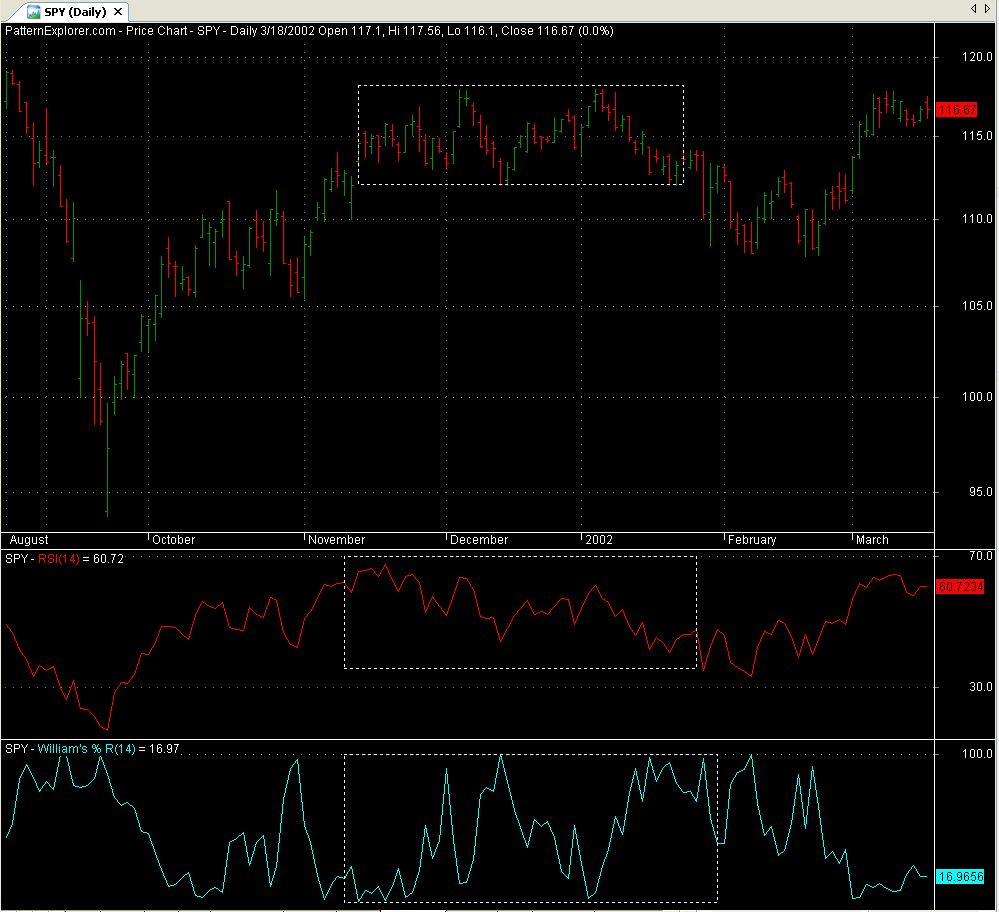
The yellow line in the bottom pane is the Stochastics. Of all three it has the smoothest movement. The horizontal white lines correspond to the highs and lows or price – the Stochastics shows the best correlation to the price highs and price lows.
Try using the Stochastics and pairing it with support and resistance areas. Taking only oversold signals near support, and selling or shorting overbought signals near resistance is maybe the best strategy. Here’s a chart with only the Stochastics plotted.
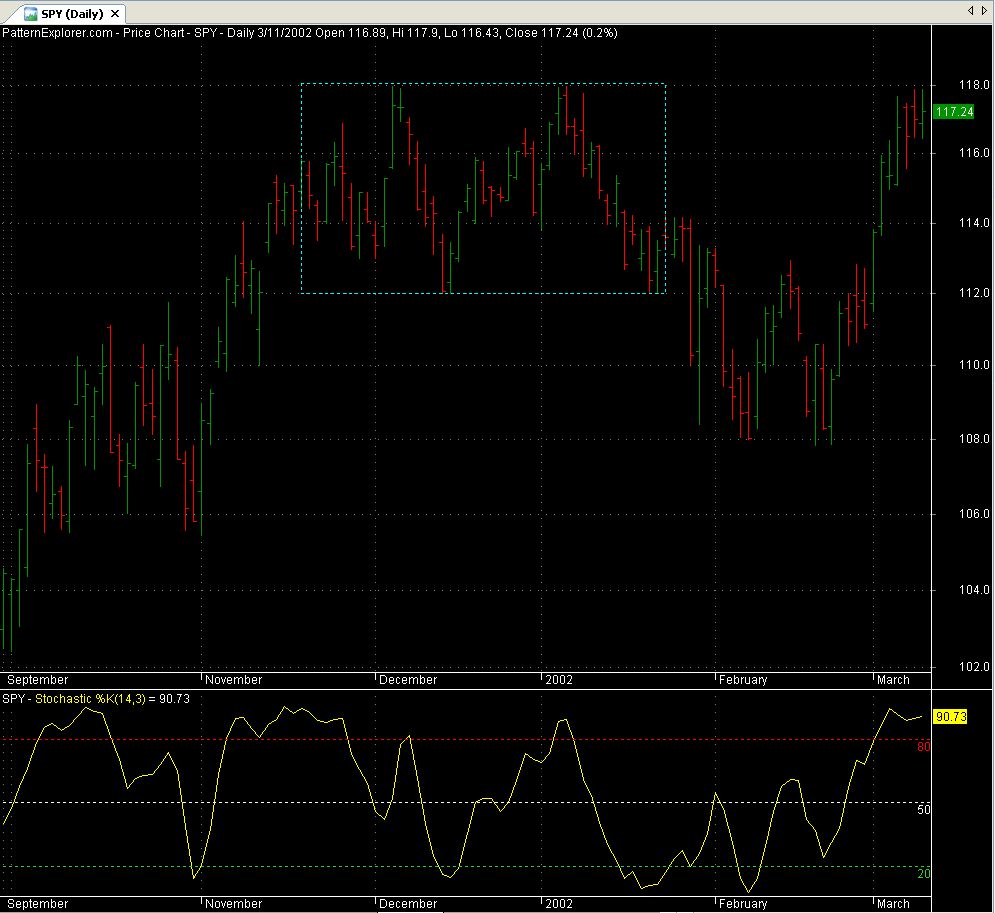
The Stochastics settings are the default settings (14, 3) and we’ll use the conventional oversold/overbought parameters of 20/80.
The first signal is an oversold signal – take a long position. The long position is sold at the overbought 80 level. Take a short position when the Stochastics curls down below the 80. That short would have been covered when it became oversold below the green 20 line.
Trailing stops is always a good idea in any market condition. Each of us has to consider the drawdown we’re willing to accept – that will help define where stops are set. For example, a two bar low might make a good trailing stop for a long. Conversely, trail a two bar high for a short position.
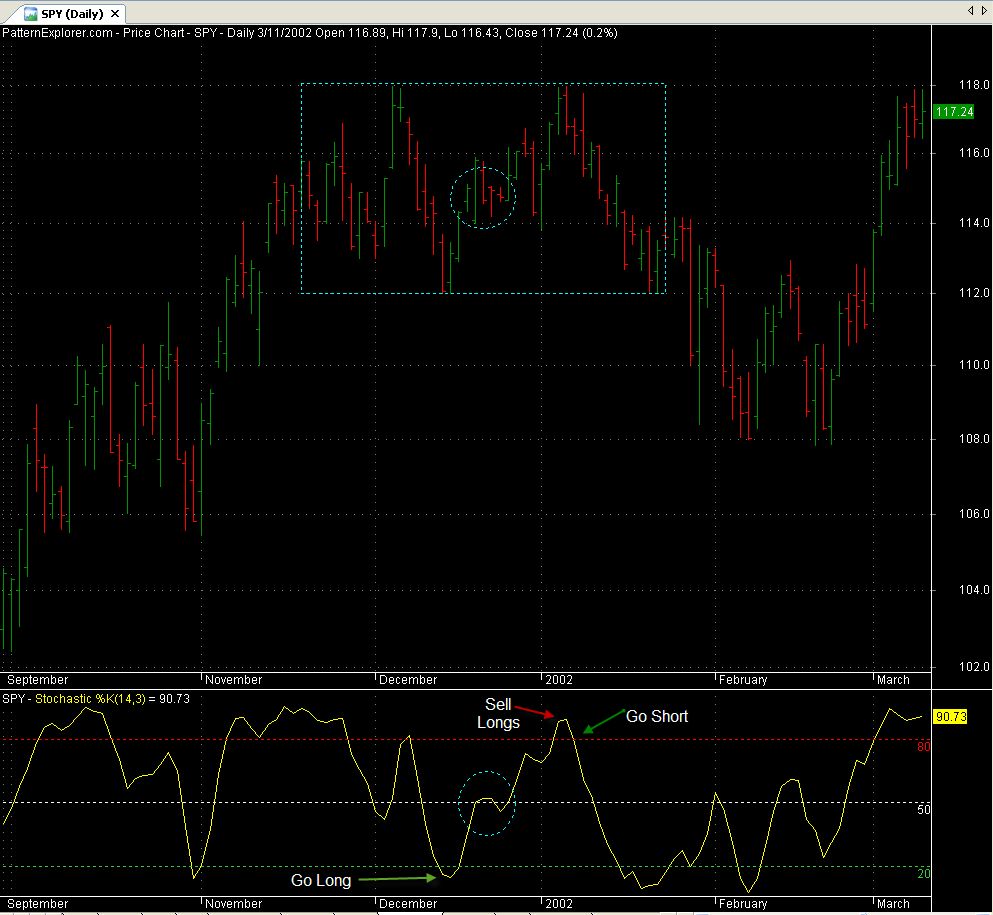
Watch the 50 line if you use this trading system. The 50 line seems to be a resistance line for the Stochastics. Oftentimes the indicator reacts at that level in a couple of ways. If Stochastics rises from oversold and can’t exceed the 50 line it is likely to fall back to the oversold level.
When falling from overbought levels the Stochastics will sometimes stop at the 50 line and go back up returning to the 80 level or beyond. Let price help give you some clues to what may happen when Stochastics reacts at the 50 level.
On the previous chart notice the blue circles on price and on the Stochastics. The Stochastics is indecisive about the direction it wants to take when it encounters the 50 level. Prices have formed a little consolidation within the larger blue box of consolidation. The way to trade this is watch price – if it breaks below the lowest low of this mini consolidation sell the position. Stick with the trade as long as price is above the lowest low.
The following chart is another period of consolidation in 2003. The Stochastics indicator wasn’t very accurate. The parameters were shortened to a 10 period Stochastics in the bottom pane, but the results weren’t much better.
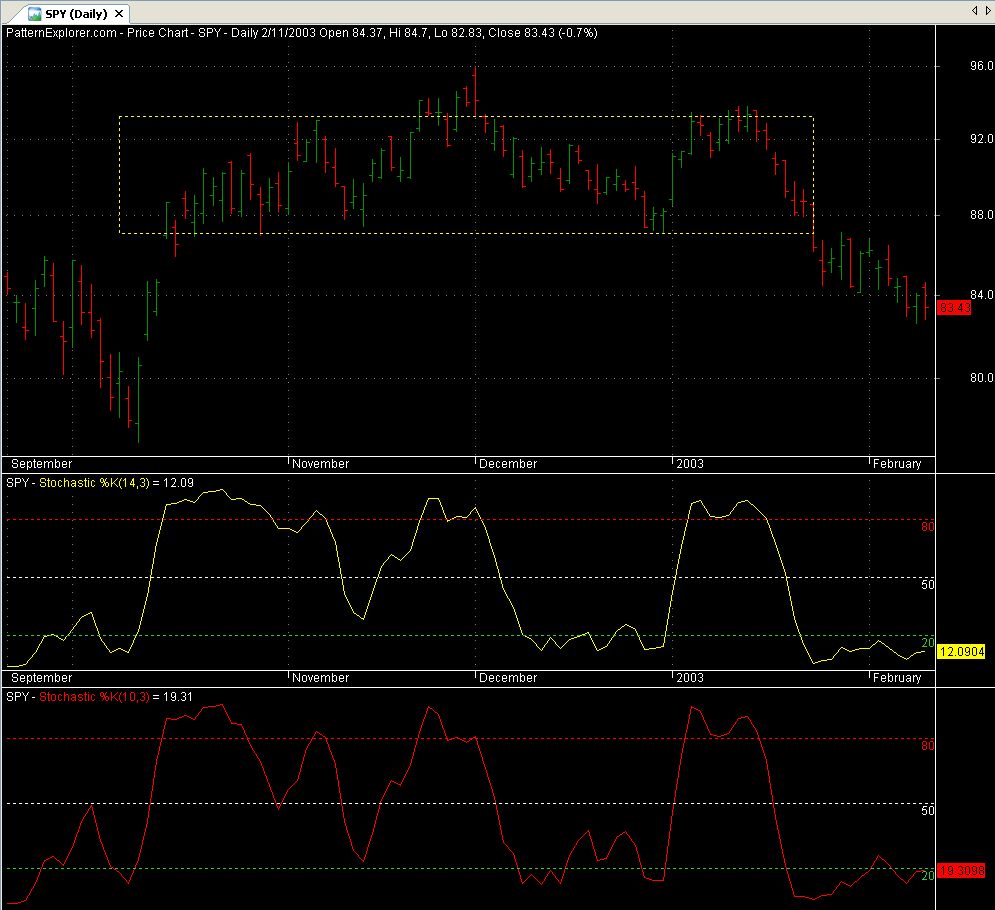
It would have been more profitable to find the support and resistance areas and trade from the price action instead of relying on the indicator.
Trying to participate in a trading market can be very frustrating. The more trading one does the more we find our comfort levels. There is nothing wrong with taking a little trading vacation and waiting for market conditions that suit your style.
I hope you’ve found a few ideas that will work for you. Good luck with your trading!
Karen Stanlake
www.RangeTraders.com./blog
-------------------------------------------------------------------------------------------------------------------------------
As a kid instead of reading the comics from the newspaper I learned how to read the bid and ask columns from the stock page. My first trade was as a teenager and I got hooked on the idea of money making money. My career spans more than 20 years. After graduate school I did a short stint as a stockbroker and then ventured out and founded my own company. Today I trade only my account and offer advice to a few close friends.
Can anyone help me?
I have been trading currencies for a while, and Im getting very good at it, following trends.
trading currencies opened the market world for my eyes to see and now Im interested in trading stocks.
I have been looking for a broker that I can use to trade stocks, but it seems that only U.S. citizens are allowed to do so, and beign a Mexican Trader I have a very limited number of brokers that can offer their services "outside or offshore the country". Can anyone help me find a broker that I can use?, or maybe my approach to the stock market is wrong.
Francisco: I now use Think or Swim (TOS) for my stock trading. I am based in Ireland and have had no problem from TOS in that regard. You can trade Forex on TOS.
I also still have an old account with My-Track and once agin never any problems.
Happy Trading
my own is that ,i have not seen any person that have busted that he have made big money from forex .why is it so
Thanks Karen,
Very well done, I've learned more on this blog in an hour than anywhere else. Am totally ignorant of Stock Market Trading, though have wanted to put my toes in the water for past 20 years. Too busy earning a living to make money, I suppose.
Now I am retired, I am determined to study the Markets via Market Club, with the aim of becoming a trader within 6-12 months - depending on my progress and success using Simulated Trading.
I have also greatly appreciated tips re Software to employ, from yourself and other bloggers. thanks to you all.
Charles
First of all, let me say that your charts with different indicators are good.
Most " newbees" must experiment with indicators on several times and several markets. Before you get a satisfaction you need a lot of comparing, knowing what those indicators to use and what they are standing for.
Your first chart, with RSI is telling as mutch as other charts with other indicators. On the RSI indicator you could see that price had to go down as RSI is indicating lower tops and price is moving higher. The 2 tops in price with equal high compared with RSI lower indicates a fall of price. As i can see on the stochs, the divergence is more difficult to see if there is one.
For me, everybody has to develop his / her own system because if you copy an existing system, there is a big chance you wont work with it because you dont feel "it"
for charts, i use ENSIGNSOFTWARE and ninjatrader
have many profiable trades
Wout
There are some very good posts here. I usually try and give credibility to all new suggestions and the internet course and chart providers. I am testing one now with a SMALL amount of my own money. This one is showing a severe downtrend on the software so I sold it short. So far it is going UP instead of down, so I may lose if it hits my stop. I find this is a good way to test the ideas of others. Sometimes I gain but I do not get excited about a flash in the pan.
Joe
Again, just wondering what software you are using??...Haven't heard back
Hey John,
This is the popular question of the day! I use a couple different software packages to do what I need -- Telechart and Amibroker.
Hope this helps, John.
This is one of the mmost enlightening posts I have ever read. I have been looking at two of the three indicators you mentioned to make my decision. No wonder I have been unhappy. I would also be interested in whatever software package you use.
John
Very good post and one of the better ones describing the differences. I, too, am interesting in which software package you are using. Nice credible explanation. For me, if the market is range bound, I will sit on the sidelines and be patient and wait for the trend; I am not a day trader anyway. The big question, of course, if figuring out when you are entering the trend or trading zone. I like the way you use the trendlines. Best trading to you.
David
Thanks for the kind words --
Your "big question" is one we all have. I just put up a "Mini-Course" that steps you through my process of finding a new trend.
Thanks -- much success to you, too!
Good Morning
I have been reading various financial commentaries for years.
Doug Casey, Porter Stansberry, Stock Gumshoe, Market Club, etc.
I have tried some subscription services, mostly lost money.'
My instincts seem to be better than the advise. I have had
a difficult time finding a product which provides charting
services which I would be comfortable purchashing. Would
it be possible for you suggest a place for me to start the
selection process?
Thanks, great article
William
What software were you using in your explanations? I'm looking for a good software package.
Those charts are from Amibroker -- I use Telechart, too. Amibroker's formula language is easy to use, has a backtesting feature, and bar replay. It reads Telechart data, too.
DEAR SIR,
PLZ TELL ME HOW I CAN TRADE WITH RSI OR STOCTACTICS IN INTRADAY RANGEBOUND MARKET I LOSE HUGE MONEY IN INTRADAY & PLZ TELL ME ITS INTRADAY PARAMETERS
Siddharth,
That is a lot of information that you need -- you might pick up a few ideas on my blog -- http://bit.ly/cLJIFs or at http://www.TradingSystemsSite.com
Hello Karen,
Try RSI 21, Stochastics 47-2-2, 15 min. chart. When the rsi goes higher than rsi uptrend.When the 3 lines come together, watch it,
change is coming. The same when rsi stochastics are down. I have charts where I can overlay 2 or more indicators. The charts are free
on the internet (free power charts on Google will bring you there).
Always look at the other time frames as well. Good luck trying.
hi
if u want to trade intra day don't see intra day charts see daily charts for intra day