
 Today's guest is Gary Wagner featured Trend TV author and founder of Wfgforex.com. Gary is going to share with us part 3 of his "Gold and the New Technical Triad" with traders blog readers. Be sure to comment with your thoughts on the gold market.
--------------------------------------------------------------------------------------------------------------------------------------------------------------------------------------
Gold which has been trading higher the past few weeks is, I believe, is in a correction within a corrective phase. That is to say it is going against the short term trend as it moves higher. I am fundamentally extremely bullish on gold, and in fact believe that it will surpass 1265 and trade to 1300 an ounce. However, before we get there I think we will need to weather one last correction.
In this, part three of a blog I began on may 13, 2010, we've followed gold as it now enters the final portion of this corrective phase. I believe that in the proper hands, wave theory will provide genuine and relevant market insights, and in the wrong hands will enable a lot of skeptic’s added reasons to doubt this technique. For those who have are skeptical about the relevance of Elliot wave, I hope that this blog might cause you to re-examine this technique again.
Ralph Nelson Elliot knew that there was a rhythmic regularity found in all things. What we call a cycle is simply that there is a phenomenon of repetition or “rhythmic reoccurrence” which is prevalent in nature. Elliot believed that these cycles where not only found in nature but also in all activities of man, including finance. It is from this assumption that he was able to theorize and create a model for his wave principle. According to this theory, markets will always move in a cycle or pattern. This concept is the cornerstone of his “Wave Theory.”
One complete cycle is made up of eight waves, which are then divided into 2 main phases; the impulse and corrective phases. The impulse phase moves in the direction of the trend, while the corrective phase moves opposite that prevailing trend. This cycle will continue until the current trend is exhausted.
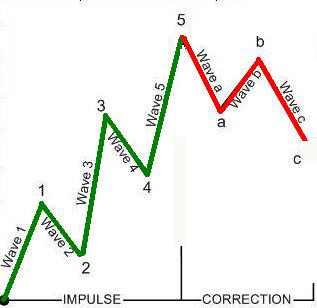
The impulse phase, also called a full wave, is composed of 5 impulses. Three move in the direction of the trend (waves 1, 3 & 5), and two against the trend (waves 2 & 4). The corrective phase consists of 3 waves; A, B & C. Waves A and C will move in the opposite direction of the primary trend and the B wave in the direction of the primary trend.
During part one of this blog on May 13, 2010, Forex gold was trading just about 1215. It was then in the longest of the impulse waves, wave 3. Figure 2 is a daily chart of Forex gold, starting with wave 1. This wave will always be the benchmark by which the other impulse waves are measured. Using a simple calculation, which states that wave 3 should be about 1.61 the size of wave one (wave 1 was $100.00). We projected the top of this wave at 1246 (1085 +161). The top turned out to be 1248. Using this same forecasting model on wave 5, wave theory again was able to provide us with great insight. Again using a simple calculation, which states that wave 5 should be about equal the size of wave one. We projected the top of this wave at 1265 (1165 +100). The top turned out to be 1265.
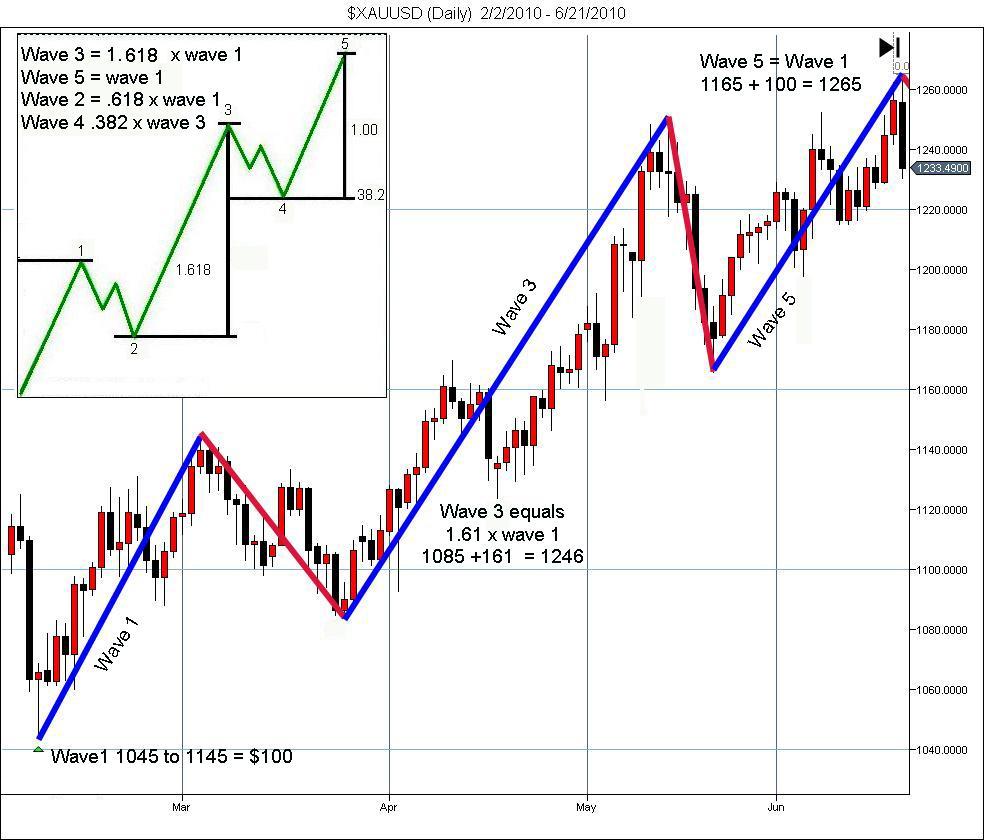
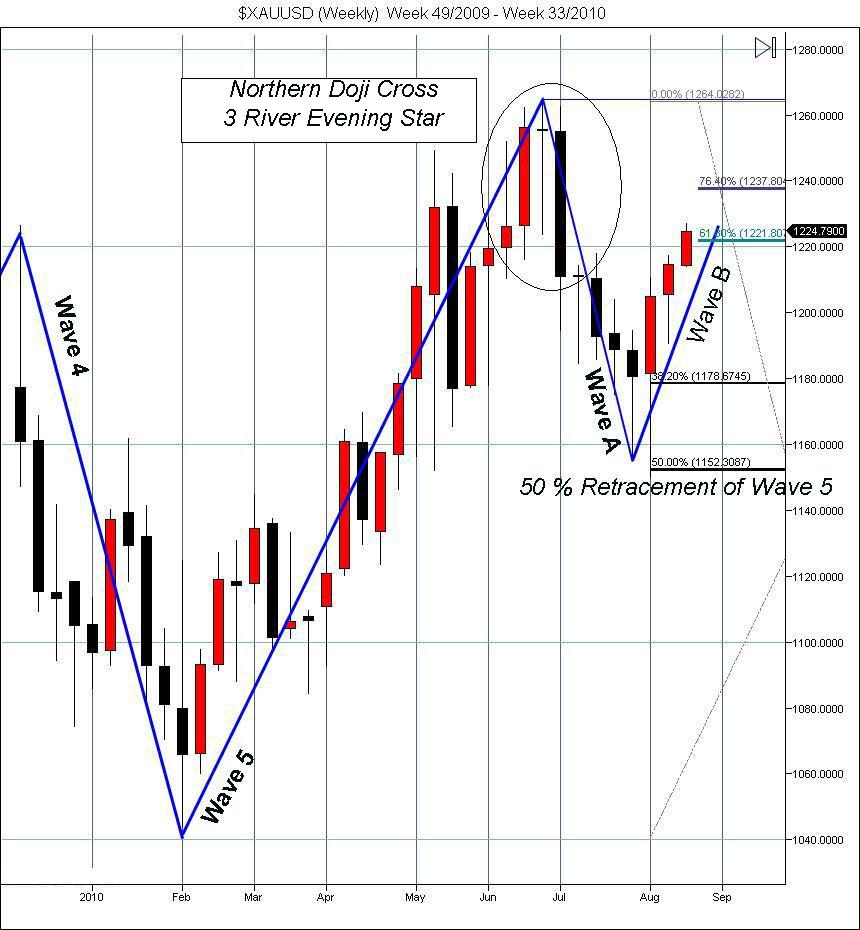
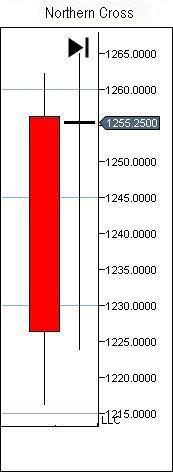
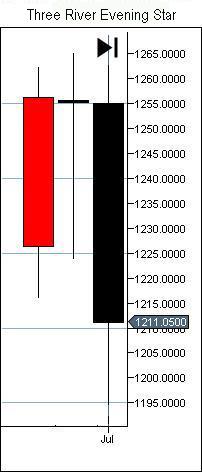
Figure 3 is a weekly Forex gold candlestick chart. Currently we are in a corrective phase. It might not seem like it with the market just $40 dollars shy of the new historical high of 1265. I find it interesting that the top to wave 5 formed a perfect Northern Doji cross (figure 3a) which became a “Three River Evening Star” (figure 3b) the next week when a black candle formed.
This weekly chart takes us to our present day market. Wave 5 ended at the point in which gold trade to a new historical high of 1265. By looking the Fibonacci retracement of wave 5, we can see that a bottom of the first corrective wave “A” formed at just about 50 %. A candlestick called a Hammer (figure 3c) signaled the start of wave B, our current wave. Currently (8-16-2010) it is trading at 1226, it is well above the 61 % retracement of the “A” wave and looks as though if it does not correct here, it might be headed to test the 78% retracement level of wave ”A” at 1237.
At this point it might appear as if gold will go to test historical high, unless we consider the wave count.

Now that wave A has ended and wave “B” is fully in place, we can plot a much better projection of the final possibilities of this corrective phase. If the Elliot wave count continues to effectively track gold prices then we can expect one more corrective wave, the final “C” Wave. This will take place at the conclusion of wave B. The “B” wave will typically end somewhere between the 50 and 75 % retracement of the “A” Wave. Currently trading just above the 50 % retracement of “A”, we will have to see where it finally tops. Figures 4a through 4c are weekly gold charts, they all postulate possible scenarios for this final corrective wave.
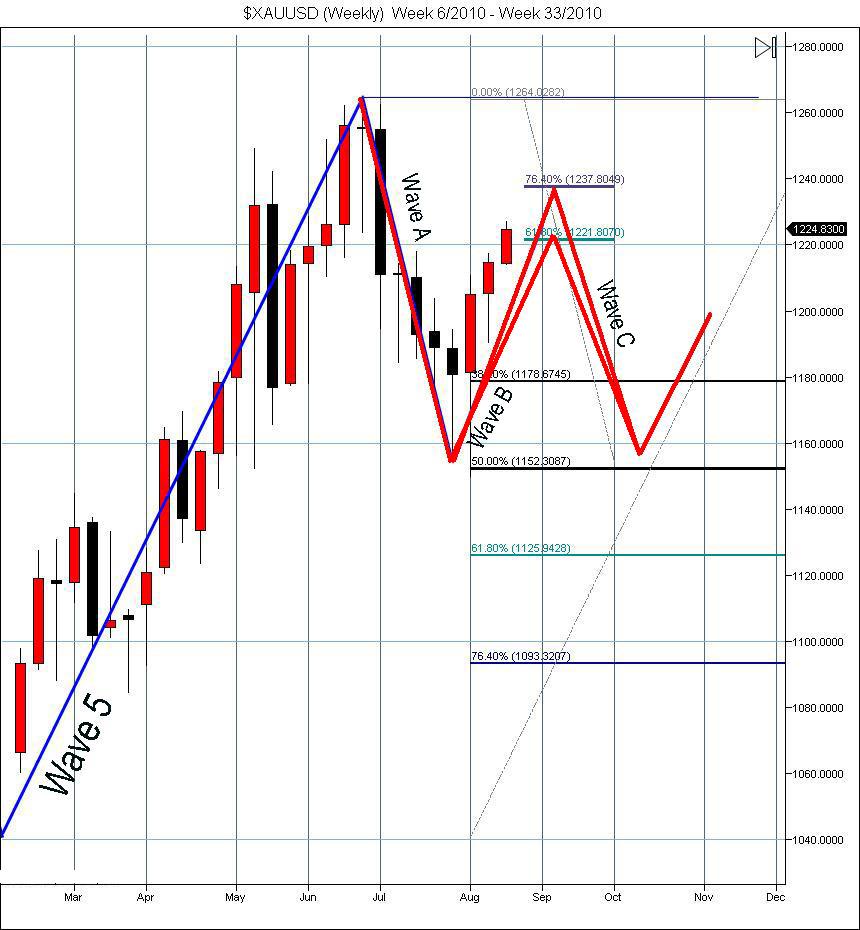
Figures 4a is an example of a flat correction. The key to this correction type is that both the A and C waves have similar lows.
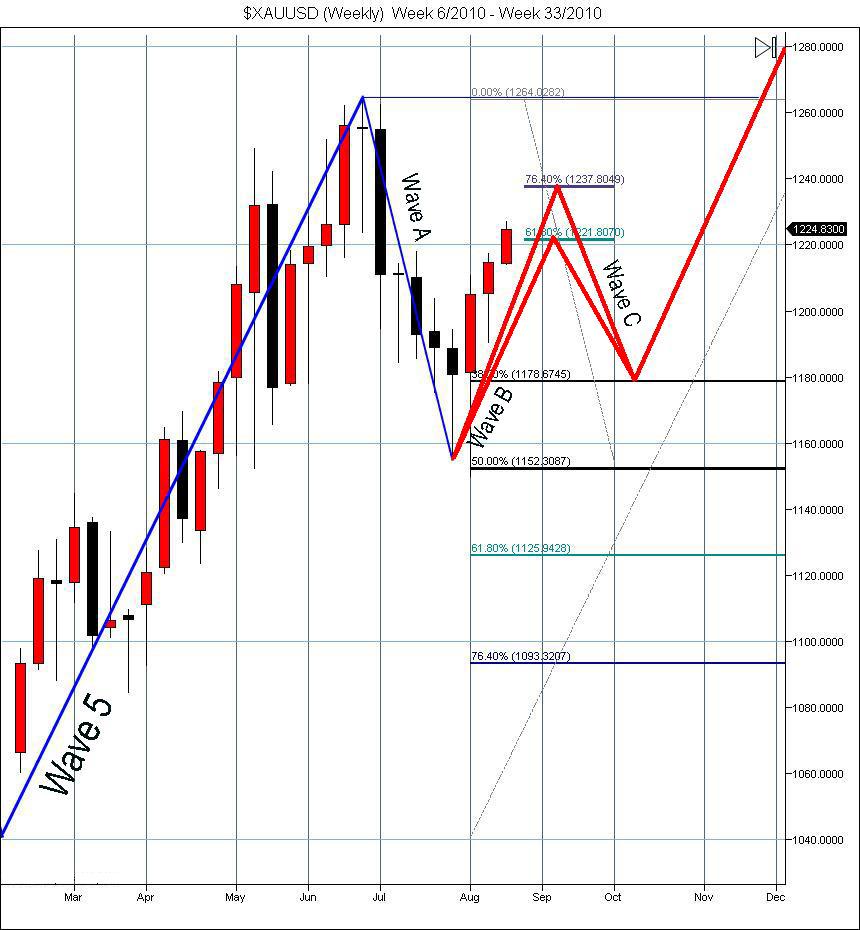
Figure 4b is an example of an irregular correction. Just as the name states this correction falls outside the expected guidelines of a traditional correction. In this example wave C’s low is above the low of wave A. Another type of irregular correction would be if the current B wave made a new high, above that of the last wave 5’s high.
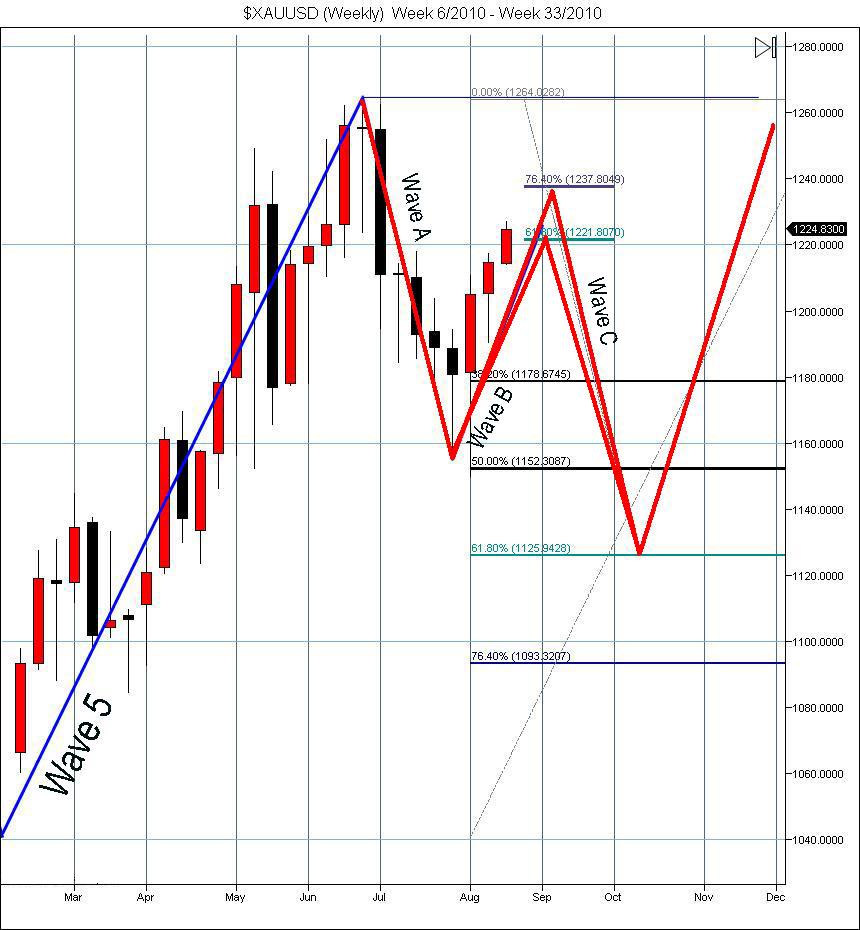
Finally in figure 4 c, we see the mother of all corrections, the standard zig-zag. Because of my fundamentally bullish take on gold, I think this is the least likely of these three scenarios. A standard zig-zag must make a lower low than the low of the first corrective wave “A”.
I know that some might think I am a contrarian after reading this blog. How can anyone be bearish on gold at a time like this, when the market is clearly moving up? As I said fundamentally I am a gold bull, but technically I think that this correction might have 1 more corrective wave after the conclusion of this current B wave. Markets rarely move straight up or down. This current Bull Run in gold is 5 years old and I think it is far from over. However, we need to pay attention to the signs along the way, and know when strategically enter and exit the market.
Here's to your trading success,
Gary S. Wagner
wfgforex.com
Gary S. Wagner a technical market analyst for twenty five years is the executive producer a daily video newsletter “The Gold Forecast tm” for wfgforex.com. He is the Co-author of “Trading Applications of Japanese Candlestick Charting”. A frequent writer for Technical Analysis of Stocks & Commodities magazine, he also Co-developed software applications for market forecasting. Gary can be reached at ga**@wf******.com
Alex,
Please take a look a the link to my video which shows how I revised my wave count
http://www.youtube.com/watch?v=RkSl7hwZX50
I think that will show you my current belief
Claude,
We both are talking about wave C ending at the same time on July 27, but I'm talking about wave A starting on May 14, with an irregular wave B going above the last wave 5's high on June 18.
If we're in wave B now as Gary was theorizing, it's coming close to testing or exceeding the last highs.
Is anyone as fed up with the Fed as I am? Aren't they one of the greatest threats to peace an prosperity on the planet?
Alex,
You are correct ... and I stand corrected. I did revise my count shortly after this blog. MPy revision can be seen here
http://www.youtube.com/watch?v=RkSl7hwZX50
There are a few of us that use EW and speak on a weekly basis, we all came up with this revision at the same time. Please It is I that was in correct, not Elliot Wave.
Used properly it can give you great insught, but also we a technition do make mistakes. In this case once new information came to light, I had to rethink the wave count. I am human ... I am NOT always correct
Alex,
Exactly what I said was happening on 18 July....
Is anybody still putting "stock" into this thesis? What if wave 5 ended in the week of May 10 and then we got an irregular correction where wave B, ending the week of June 14, "made a new high, above that of the last wave 5’s high" as you put it, Gary? Then, gold's ABC correction would have ended week of 26 July and it would be in wave 1 now. I'm not experienced with Elliot waves, but is this an interesting question? Looking at a silver chart, it looks like it's wave 5 ended last November, it completed an ABC correction to Feb. 1st and is now in wave 3 and breaking out just this week.
Todays Video Gold Forcast
http://www.youtube.com/watch?v=_BSOJ9hKbD4
Gary Wagner
wfgforex.com/ino
Trade Detective,
We technition are NEVER always right. When I am not I say so ! But is EW with candlesticks and Fibonacci worthless ... I think not
Today we saw the candlestick pattern that I believe confirms a conclusion to this current "B" wave in gold. In both the Forex as well as the Comex we have a variation of a "Three River Evening Star". In the Forex we also have an Engulfing bearish pattern that follow yesterdays shooting star.
what works for you is great, and just because I might not understand or have mastered it I do not call it worthless
Gary
SuperCycleBear,
Thank you. It does appear we might in fact got a top to this b wave. We will need to see next week.
Gary
Excellent analysis. Clearly explained with appropriate respect for the market. I also use candlesticks and EW (as well as market profile and other tech indicators) but not to the clear depth that Gary has on display. I agree with your call and do not like to go against the trend. Hence while I will reduce any leveraged exposure to the gold price, there is absolutely no way I would sell my physical. Just use the coming correction to buy some more and find a better entry point for leveraged positions.
Hello to everybody and thanks to Gary Wagner for such detail job he did.
Reading all comments abouve I would joing to John's words, as there no 100% perfect theory for trading. Eliot's plan was perfect for him and can be only good to us and never perfect, as Eliot waves outline all being and nature on our planet and must be evaluated as a general and very close example, but not persistent one, because if we apply Eliot to perfect trend it will work, but looking on current magor and small trends we see WAVE B as a firmly straight last wave up, and I would say there going to be just a small correction down to 1200 and then there going to be small creationg of energy field with projection up to about 1275 after this If Weekly or Dayly candles appear with bigger tile on tops then I will suspect trend will start reverce down as much even as to $912.5. Yeap guys, "IF" let see first candle set up at 1275-80.
Good luck to everybody and remember YOUR PLAN IS THE BEST.
Regards.
Ivan
Pete,
The charts I use I can keep the wave count on the chart and move from daily to weekly by compressing the charts. The wave count stays the same. I used Weeklys in this one because of the candlestick pattern (3 river star with doji) was a excellent pattern to show. If you go to the first page of my website wfgforex.com click the chart and you will see the same wave count on a daily chart
Hope that answers your question
Gary
Very clear and valuable analysis.
From Bloomberg Investment Company ,Kathmandu, Nepal.
wow, gold went up to 1236.xx. now it is going down.
Gary Wagner , you had a great article. Thank you for sharing.
I don't get it.
Why has he changed from daily to weekly when calculating wave A, B an C? If you stick to daily, you will see that wave A has gone more than 100% ie. below the low of wave 5 - therefore wave A is not 50% of wave 5 but in excess of 100%. Why switch time frames mid stream?
Question 2:
At what wave do you decide you have this Elliot wave set up? I'm guessing by wave 4. If that is so then you have missed the biggest move on wave 3. Am I correct?
This is great technical analysis. Very good to see this. Of course we know that the market is also given impetus by world events, not just technical analysis.
Dear Gary,
A lot of relevant comments alrady posted that mirror my thinkiing. So to cut to the chase, are we to expect a correction wave C in the next 1 or 2 weeks or does wave B currently at $1229 merge with the primary trend's next Wave 1 to boost the price further?
Your advice will be appreciated. Thanks!
Us technicians, including myself made 13 wrong market turn decisions over the past year or so. Apparently there are forces at work we can't see. That is the thrill of taking up the challenge. The thrill of using whatever edge we use and see it work is very rewarding.Those thrills and chills come from our own favorite personal probability tools. We all use different tools. That's good, or we would all be right at the same time and markets wouild be boring.I like the wave count, use it sometimes when I can clearly see it.I've also seen demos of the Trade Triangles, they are exceptionally nice. I think the market knows all, without reading the news and listening to the Cramers. I also feel as a personal discipline rule that it's important for me to be able to stand without help from special forces and services. It ain't always easy, on the lonely road.
In my opinion, I think the Gary Wagner EW explanation is the best I've ever seen, a very easy read on subject I thought I knew, but did not. I think I'll put it in my probabilty tool box and use it judiciously.
Thank you very much Gary.
Larry
Escellent point ... i do not think you can use Ew for entry and exit points AT ALL ! I use candlestick patterns and look for them at key Fibonacci points ... EW simply gives me the big market picture ... Well said
trade triandles are excellent , i do not suggest not using them, rather I only suggest another tool
Excellent article. I do use Elliott wave to have a sense of the overall picture and trend but not when it comes to precision entry/exit points. If used as a trend following method key and critical support levels have to give way to confirm an Elliott wave and by that time there's often not much left to trade. Alternatively using EW as a counter trend strategy will inevitably lead to a lot of false signals and not as accurate as Demark. I do think EW is good at confirming a trading strategy which is less subjective but in real time trading it requires a lot of faith and deep pockets to use EW as a primary method.
If you want to make money trading gold, I really suggest that you follow Gary Wagner. He uses Elliot Wave and Japanese Candles. He is really knowledgeble in both subjects. I also use the triangles. The problem with the triangles is that when gold market is trading sideways, it gives you a lot of false signals.I really encourage you to check Gary's daily video forcast. I guarantee you that you won't be disappointed.
Someone may have been a brilliant proponent of a theory that does not mean he has mastered money management.
My broker has a whole chat room dedicated Elliot wave, hosted by a descended of the original Elliot. At the moment, I'll just stick with trade triangles ... I need zen-like simplicity in my trading life.
I have been folloeing the trade triangles used here at Market club, and find them to be EXCELLENT !!! However what I am suggesting is not to abandom them but rather see that there are other techniques that tend to be leading indicators, and combining both to your trading benifit makes sense
Thank you, although not really highlighted in this part (part 3), japanese candlesticks play a huge part in my daily commentary and market outlook
Fundamentally I am extremely bullish on gold I have been using Elliot wave to recommend market timing for my subscribers of “The Gold Forecast”. I also use Japanese Candlesticks, which I found when you combine them can lead to good insight of market behavior. Van Gogh also died a poor man, but his work still stands today as brilliant. And yes I hope we do not have the same fate as either.
You obviously don't know enough about the "EW' Principle to comment on it.
There are no perfect trading plans. But I'm sure your 'Plan' is better than all the others!
John
we are at 1231 right now...so if gold breaks 1240 this week and holds then no C wave and Gary is wrong?
The analysis is good but not the last ABC part.
Wave A starts on 22 June and ends on 1 July.
Wave B starts on 1 July and ends on 18 July.
Wave C ended on 28 July.
This means that the correction has ended and we are now in a new uptrend impulsion.
Wishful thinking???
In my opinion Elliot Wave is next to worthless for making trade decisions. When E.W. is applied, and turns out to be incorrect, the gurus just shrug it off with the assumption that they just "got the wrong wave."
In other words, stick to trading concepts that are simple, and proven effective: Price patterns, trend lines, Trend Strength, and Volume confirmation. Trade Triangles do a very good job of confirming these principles.
"Robert Pretcher, who made millions rightly predicting the fifth Super Cycle wave from 1982 to 1987, is now poor too because he made a call for a super cycle bear market which never materialized."
Take a good look around, my friend. We're seeing it NOW.
Not selling my gold. I've been hearing about corrective patterns for the last three months and yet gold has continued to rise. Gold protects against political instability and uncertainty - I'm pretty sure we have plenty of that to feed gold for awhile.
I don't understand why so many traders dislike gold? Is it because it can't be printed? It wipes you traders out every 10 years? What is it?
Right now all of our Trade Triangles are green, with a +100 rating. I think I will stick with my Market Club system,which should get us out pretty quickly, if you are right with the Elliott Wave theory.
Excellent- clear and understandable definition of Elliot Wave Theory- with a current market and projections- Excellent!!
I think this is great work Gary, and thanks for sharing. Investors should learn about Elliott Wave theory, and also not assume that because some are very poor at applying the theory that it doesn't work. In your case Gary, you clearly know how to work within the theory bounds and also apply Fibonacci sequencing as do I successfully. Nice article, and I agree a Gold pullback is nigh.
Although I agree that such technical analysis has its uses in a free market, can it really aid understanding the highly manipulated gold/silver market.
The Fed admits to intentionally suppressing the gold price, and the COMEX silver price is a joke (look at the premiums on silver coins). Your charts fit the actual price quite nicely, day to day. But how good are they in predicting the big moves that are engineered in the back rooms?
I enjoyed very much your exposition. I am myself an Elliot fan.
However, it might be useful to remember that Ralph Elliot died poor. Moreover, the most famous Elliott follower in stock market history, namely Robert Pretcher, who made millions rightly predicting the fifth Super Cycle wave from 1982 to 1987, is now poor too because he made a call for a super cycle bear market which never materialized.
So good luck! Let us hope that we all shall not meet in the poor house like all the Elliot followers who fore came us!