
A new feature to the Trader's Blog will be the addition of the Chart of the week. Each week Longleaftrading.com will be providing us a chart of the week as analyzed by a member of their team. We hope that you enjoy and learn from this new feature.
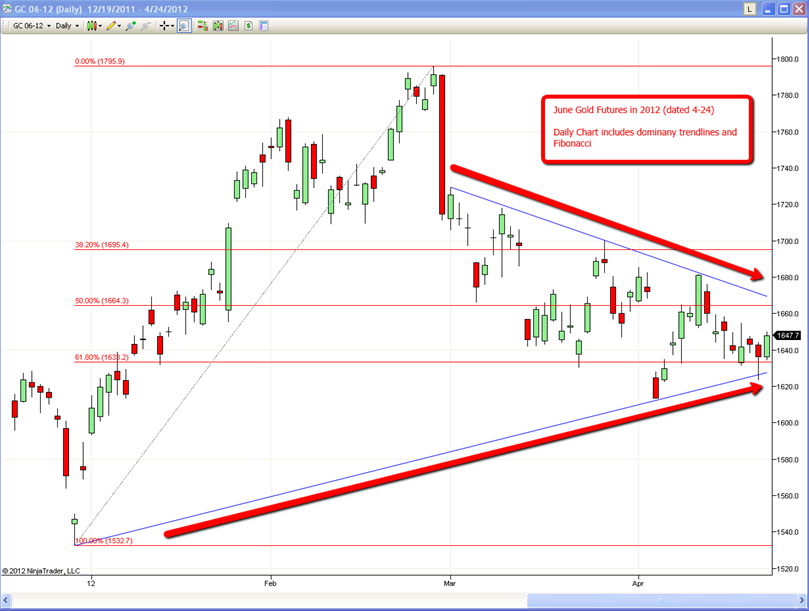
June Gold has been incrementally moved lower since late February. The selloff began after the market failed to break above $1800 and at the same time, investors learned that the US FED planned to participate less in easing our economy. What began as a very sharp drop in the precious metal, then turned into a relatively rangy trade. Traders know that seasonally Gold tends to be a rangy summer market, followed by anticipatory purchases ahead of India’s wedding season. It will be important to watch whether India’s government will impose a tax hike to offset their trade deficit this year, and more importantly traders will continue to watch for any improvements in Europe or hints of easing from the US FED.
Technically, Gold traders are well aware of the narrowing range in the Gold market identified by the red arrows. A firm breakout above or below these trendlines would likely attract more volume to the market to speculate on a direction.
Brian Booth
Sr. Market Strategist
Yesterdays FED announcement was played well by the FED. It was just enough to bring a bit more volume to the futures markets, but a far cry from where we were a few months ago. The battle between the US Dollar and the Euro is important to watch, and also crucial when deciding on a direction in Gold prices. Yetsreday, the FED did not announce another round of easing, but DID say that they will consider it again if the markets saw a string of bad reports domestically. That statement was enough for traders to buy the break in Gold, right off of the dominant support trendline.
It should be noted that there are many markets (futures charts) that are stuck in similar narrowing patterns like Gold (See the June Dollar, June Euro, July Silver). A few actually broke out of the same ranges after the FED announcement (See June S&P 500 and June Crude Oil). The question will be whether or not the precious Metals will follow this pattern and break above the range. The next few days of trading will be very important.
I don't think deflation is obvious enough for the Fed to announce QE3.
So I expect Gold to chatter today and tomorrow but continue the slightly negative bias.
Branden, Thanks for the seasonality chart.
Scharr
Chatter is right Stan!
Here is another daily chart I like also to show the trading range. It is a nice link that updates itself everyday.
http://www.kitco.com/reports/template_jimw.htm
The best thing I can do for my clients is place trades in the bottom of the trading channel these days.
Brendan.
Thanks, Brendan, that's another good site. I guess the Bernanke did have an effect on gold. Promise us the moon. WOW.
If you are really into watching gold, email me, and I will send you the five links that will be all you need on a daily basis to watch the trends and "real time" moving averages!
BB
I'm really interested. Can you give me your email address. Thank you Brendan.
Just click on my name, it goes to my personal page with email address.
I still use the 4o-year seasonal charts for big picture analysis and conformation http://www.seasonalcharts.com/classics_gold.html
Very interesting site, Brendan. Thank you for posting.
My pleasure, hope it helps. I followed spot action in 2009 vs. the historical chart and it was generally "spot" on. One of my clients reminds me thought that the rules are changing so historical averages will become less reliant, but it's just another tool. Tomorrow (4/26) is contract settlement day which also has a history of pulling prices down. Let's see how the Bernanke speech today and contract settlement tomorrow play out together.
Let's get some more votes!
Is gold going down or up when Bernanke speaks today?
Wow, that's a hard one, Brendan. I don't think another QE3 is popular with the American people and this is an election year, but no one wants to see the market tank either. Economic news was a disappointment today, and without AAPL, the market would probably be down. Our economy is not healthy, no matter how the media tries to hype it. Okay, here goes. I don't think the fed will do much today, so gold won't move much in either direction. How's that for neutral?
Just out..."The largest gold ETF in the world, GLD, is experiencing a significant spike in volatility leading up to today's Fed comments at 2:15 EST. These comments are expected to be round two of a battle between the Federal Reserve and gold that began in Feb."
http://seekingalpha.com/article/526721-gld-vix-spikes-significantly