
Each Week Lo ngleaftrading.com will be providing us a chart of the week as analyzed by a member of their team. We hope that you enjoy and learn from this new feature.
Weekly Gold Report (April 22nd through April 26th)
Without any big news to play off of, most markets begin the week a bit flat. Traders this morning are trying to decide whether the only standout rally in the Gold is here to stay, or if it is an early stop hunt to begin the week. We won’t soon forget the Sunday overnight in the Metals last week when Gold continued a drop that we have not seen in over thirty years. So who can blame anyone for being once bitten, twice shy?
A scan across the board does not reveal much except for a majority of the market sectors making an effort to retrace the price action we experienced a week ago. Korea has been rather silent, the tragedy in Boston is seemingly on the mend, and the parade of FED Member interviews is slowly coming to a close. In the absence of these headlines, we will likely go back to trading the actual reports that are scheduled this week.
In the US, the stock indexes will pay close attention to the continuation of Q1 reported earnings, and may set its sights on the GDP report at the end of the week. Europe reports numbers early on Tuesday and Wednesday, while Great Britain and Japan will take center stage on Thursday reporting GDP and Interest Rates, respectively.
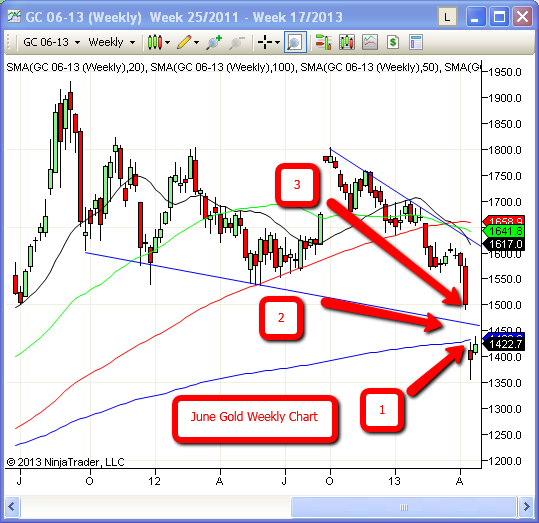
The Weekly Chart on Gold futures shows how critical prices between $1425 and $1500 are for the June Futures. On the lower end $1425 is where the 200 day moving average resides. As we move $25 higher, we run into the trendline that once underpinned the price of Gold, and will probably now provide overhead resistance on the way up. And lastly, a rally to $1500 or better will likely convince traders that last weeks drubbing was all she wrote for a while.
Thank you for your interest,
Brian Booth
Senior Market Strategist
bb****@lo*************.com
888.272.6926
** There is a substantial risk of loss in trading futures and options. Past performance is not indicative of future results. The information and data contained in this article was obtained from sources considered reliable. Their accuracy or completeness is not guaranteed. Information provided in this article is not to be deemed as an offer or solicitation with respect to the sale or purchase of any securities or commodities. Any decision to purchase or sell as a result of the opinions expressed in this article will be the full responsibility of the person authorizing such transaction.
The Fed will continue to suppress the paper price of gold with naked shorts (500 tons sold April 12-15) in its ceaseless efforts to marginalize gold prices. This is an indication of an increasingly desperate situation in the face of rising demand for physical metal. Note that there is now an increasing divergence between the paper and physical price (if you can find any for sale).
Paper Gold is a bigger threat, and try to understand, when any market is collapse, no matter, what type of forms involved therein, and all such forms affected altogether, with some negligible or marginal difference.........billion dollar question is.........what is the basic market trend........and last but not list, fed alone, just cant control or manipulate world wide gold market.
except some short term upward movement, and price settlements, no more chances for any continued or one way bull run, don't think or expect about hedge fund support or any other bull supporting factors. sale on every rise, with individually affordable stops.
What about the news that Hedge Funders are making a buy on gold....could that hold as probability that gold price could recover sooner than we thought.