
Let’s take a look at two energy market sector markets as we enter the “Summer Driving Season”.
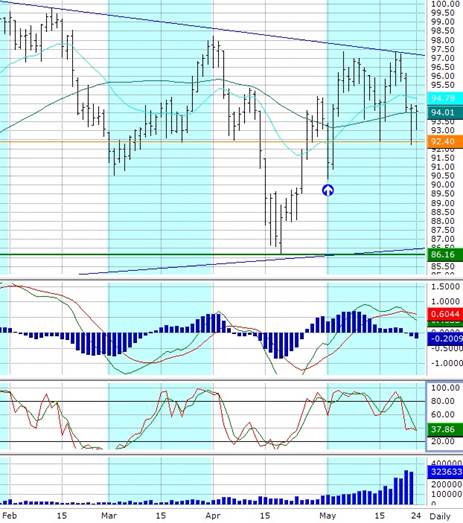
July 2013 Crude Oil
Based on Cash charts, the Crude Oil contract tends to sharply drop in June, slightly retrace in July, and gradually sell-off through the remainder of the year. Even though this data was tracked over a twenty-five year period, the contract might not always follow this pattern due to fundamental and technical reasons. The July 2013 chart appears to have found resistance along an upper trend line and technically setup to sell-off. This falls right in line with the Cash chart.
The touches (or near touches) on the upper trend line are 99.77 (2/13/13), 98.22 (4/01/13), 97.38 (5/06/13), and 97.35 (5/20/13). The Trend Seeker (a US Chart Company tool to help identify market trend) is Up, but with a Weak ranking. The MACD indicator is already bearish and above the baseline. The Stochastic indicator lines are converging, setting up to crossover bearish and above the sold line. In a wild trading session on Thursday (5/23/13), the market broke below the low of 92.40 (5/15/13) but closed 2.04 points higher. A break below the 90.32 low (5/01/13) perhaps will provide a change in the Trend Seeker and sufficient confirmation to the downside. An initial downside target is the low of 86.16 (4/18/13).
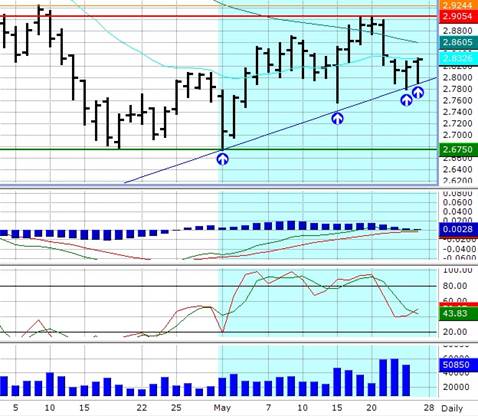
 July 2013 Unleaded Gasoline
Based on Cash charts, the Unleaded Gasoline contract tends to top out in the Spring and sell-off throughout out the Summer months. Too bad gasoline prices at the pump don't follow that model, especially here in Chicago.
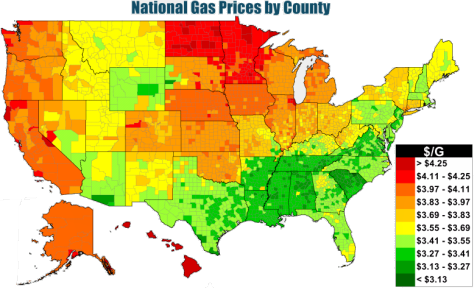 Source: http://www.eia.gov/todayinenergy/detail.cfm?id=11411
The July 2013 RBOB contract is trading along a lower trend line. There are touches on the trend line at 2.6750 (5/01/13), 2.7568 (5/15/13), 2.7792 (5/23/13), and 2.7912 (5/24/13). The Trend Seeker (a US Chart Company tool to help identify market trend) is Down and Strong. The MACD, a trend indicator, is rising but remains below the baseline. The Stochastic indicator is bearish near the middle of 80/20 scale. There is Momentum in this market as the ADX indicator reads 23.12. A close below the upward sloping trend line will trigger a short entry opportunity. Potential stop losses can go above recent resistance, the high of 2.9054 (5/17/13). A potential downside target is the recent contract low of 2.6771 (4/18/13).
Subscribe to the GBE Trade Spotlight!
The “GBE Trade Spotlight” is a complimentary service based on the GBE trading methodology designed for you to leverage the knowledge, skills, and experience of Daniels Trading. Receive trade setups, trade recommendations, and trade management emails when you sign up for the GBE Trade Spotlight Advisory newsletter!
Author: Don DeBartolo
STOP ORDERS DO NOT NECESSARILY LIMIT YOUR LOSS TO THE STOP PRICE BECAUSE STOP ORDERS, IF THE PRICE IS HIT, BECOME MARKET ORDERS AND, DEPENDING ON MARKET CONDITIONS, THE ACTUAL FILL PRICE CAN BE DIFFERENT FROM THE STOP PRICE. IF A MARKET REACHED ITS DAILY PRICE FLUCTUATION LIMIT, A "LIMIT MOVE", IT MAY BE IMPOSSIBLE TO EXECUTE A STOP LOSS ORDER.