
Today, I am going to take an in-depth look into the world of crude oil. The question on most traders' minds is, has this market finally bottomed out?
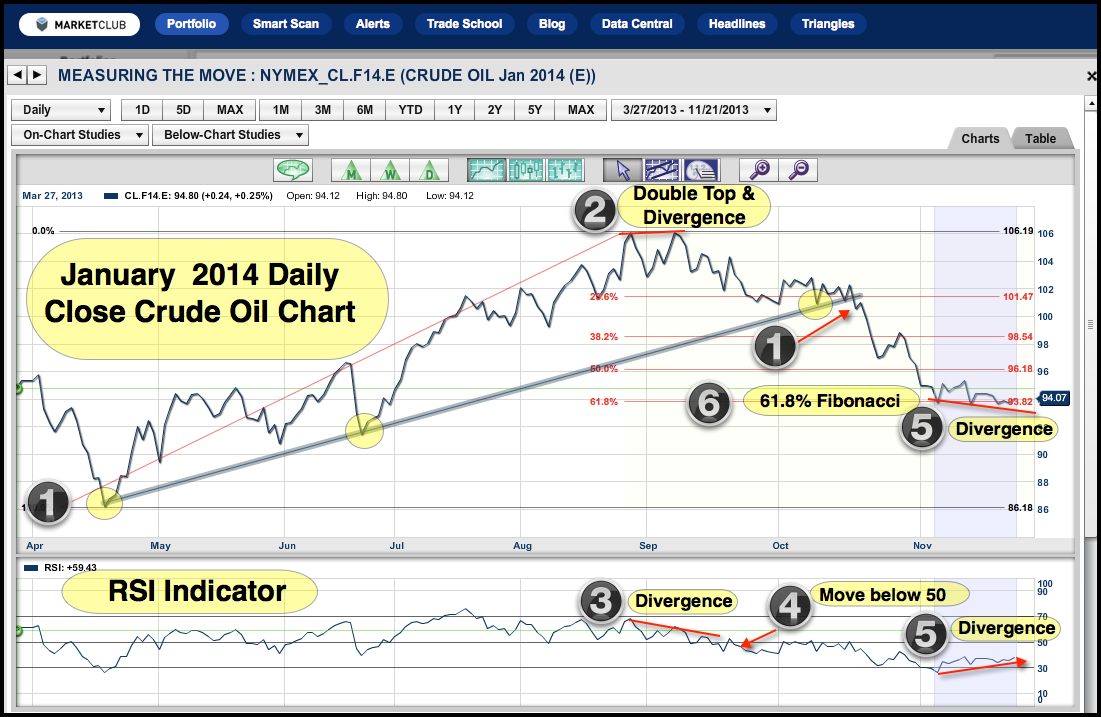
As you can see on the chart, crude oil prices have been had been steadily moving higher for the most part of this year, until they peaked in September. We see (1) a strong supporting trend line which hit three places on the chart, making it a valid trend line of some importance. This trend line was dramatically broken in October and since then, the price of crude oil has fallen from over $100 a barrel to around the $94 a barrel level. Two events indicated this could happen, the (2) double top and divergence on the chart and (3) the divergence on the RSI indicator.
1) Trend line and trend line break
2) Double top and divergence
3) RSI divergence
4) Move below 50 line
5) Bullish divergence
6) Fibonacci retracement
The move accelerated (4) when the RSI moved below the 50 line, which then became a resistance zone to any further rallies in crude oil. It wasn't until we reached (5) that the crude oil market potentially created a bullish divergence. The importance of this divergence (6) cannot be overlooked as it came from a 61.8% Fibonacci retracement support zone, which was measured from the lows in April to the highs seen in September.
As we move forward, I think many traders will be watching this market closely for a rebound back to the $100 level. Presently all of our Trade Triangles (not illustrated on this chart) are negative, indicating that the trend remains to the downside at this time.
What do you think of this chart and this market? Please feel free to share your views below.
Every success,
Adam Hewison
President, INO.com
Co-Creator, MarketClub
Support and Resistence:
http://www.booktrakker.com/Economy/CrudeSupportResistence.jpg
Finally someone looks at the charts in a simple fashion. I've found that when an RSI divergence is in place its an extremely good indication of a reversal of the entity being charted. Of course in this highly manipulated world anything could happen but I agree with Adam that a bottom looks to be in place. Interestingly enough other commodities generally look to be at a bottom.
I am going to have to agree with Anonymole, I am picking 89.75 for bottom for January crude. The downward trend is in place and all Indicators which I follow are Bearish in my opinion. Once crude breaks through 90 I would be long, as the Saudis are not going to be happy campers below this price.
Edward,
Thanks for contributing to the conversation, much appreciated.
Every success,
Adam Hewison
President, INO.com
Co-Founder of MarketClub.com
I guess I don't understand the Triangle System. Here we have crude oil with red monthly and weekly triangles, yet we are being put on alert to buy it. I thought we would be buying with the trend, not trying to "catch the falling knife" trying to guess when something will bottom out. What am I missing?
Tom,
Thanks for contributing to the conversation, much appreciated. Maybe, I was not clear enough, but I thought when I wrote "Presently all of our Trade Triangles (not illustrated on this chart) are negative, indicating that the trend remains to the downside at this time." that would tell all everyone that the trend is bearish for crude oil based on our Trade Triangle technology.
Our Trade Triangle technology is a very successful trend following tool and like many trend following tools it waits for a trend to become established before signaling a trend change.
Every trend changes eventually and crude oil is no different. The point of the post was to illustrate some technical aspects of the market that may be signaling a bounce for this market.
Thanks for the question, I hope my answer worked for you.
Every success,
Adam Hewison
President, INO.com
Co-Founder of MarketClub.com
You see the same technical movement in Uranerz Energy (URZ). Could a possitive move in oil say something about a positive move in Uranium or is it the other way around.. Cameco did already react some days ago and could perhaps be seen as a leading indicator for oil...?? or only in the uranium sector....
Uranium may be turning around as Japan is finally realizing that it's devastating reliance on fossil fuel imports is severely impacting its economic turn around. And the fact that their goal of greenhouse gas reduction will fail to be met due to this same trend in crude oil and nat.gas dependency.
A temporary lull in the descent of crude surely looks to be in place. But the commercial sellers are still in control:
https://db.tt/FsjPCOLK
[see "CL" at the bottom of the list on the left. This file takes a number of seconds to load.]
which to me means that crude is still over priced and must drop below 90 before it lifts above 100 again.