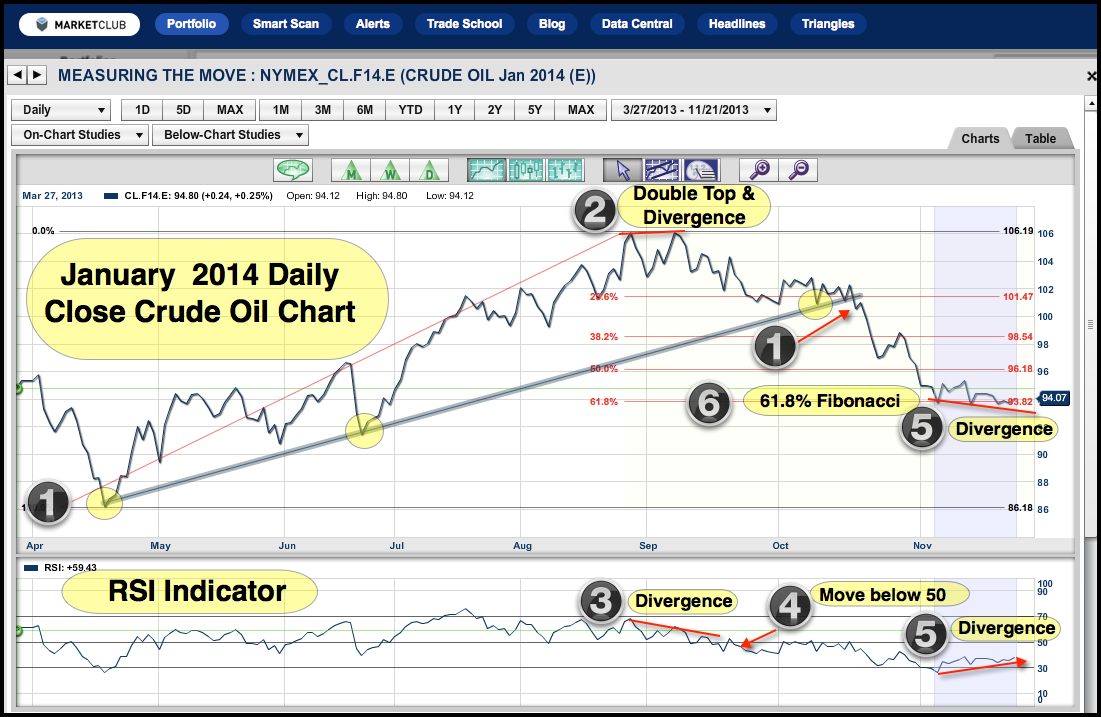
 As a special treat to Trader’s Blog readers, Ron Ianieri is offering you an in-depth look at how to optimize the ABC charting formation.
The ABC Charting Formation is one of the most basic and frequently occurring charting patterns that exist. Watch how this basic chart can be turned into a big payday with the use of options. Follow along as we use options to safely and easily follow the ABC's charting patterns twists and bends. We start out with the most basic and most easily understood strategy, roll it, morph it and finally close it. Suddenly, this simple charting pattern, traded with the simplest option strategy, becomes a sophisticated looking trading strategy that is incredibly simple to use, fully hedged at all times, and very profitable!
The concept of synthetics has always been fundamentally important to understanding options. Synthetics show us the mathematical relationship that exists between the stock, a call, and its corresponding put. This mathematical relationship not only relates the price of these instruments in relation to each other, but also shows how a call can be changed into a put, or a put can be changed into a call by simply adding the stock into the equation. Understanding synthetics allows investors the ability to morph positions from the wrong position to the right position quickly and efficiently. Understanding synthetics also allow investors to take advantage of the put/call skew we frequently see in the options market today.
Watch it now: Optimizing the ABC Charting Formation
Best,
The INOTV Team


