
Hello traders and MarketClub members everywhere! Welcome to the new trading month of February.
Today, I am going to do something a little bit different, I hope you enjoy the experience and find it educational and informative. To start with, I am going to analyze a static chart of the stock of Applied Materials, Inc. (NASDAQ:AMAT).
In addition to posting a single static chart on the blog, I am also going to be doing a video of that same chart. The video is short, to the point, and explains how I analyze stocks using the tools in MarketClub.
Today's in-depth analysis of Applied Materials shows a confluence of technical indicators that do not add up to a positive outlook for this stock. Remember, any analysis I do at MarketClub should not be considered a recommendation or an endorsement to buy or sell a particular security.
There is an old adage in trading that goes like this, "they slide faster than they glide". Translated, that means stocks go down faster than they go up.
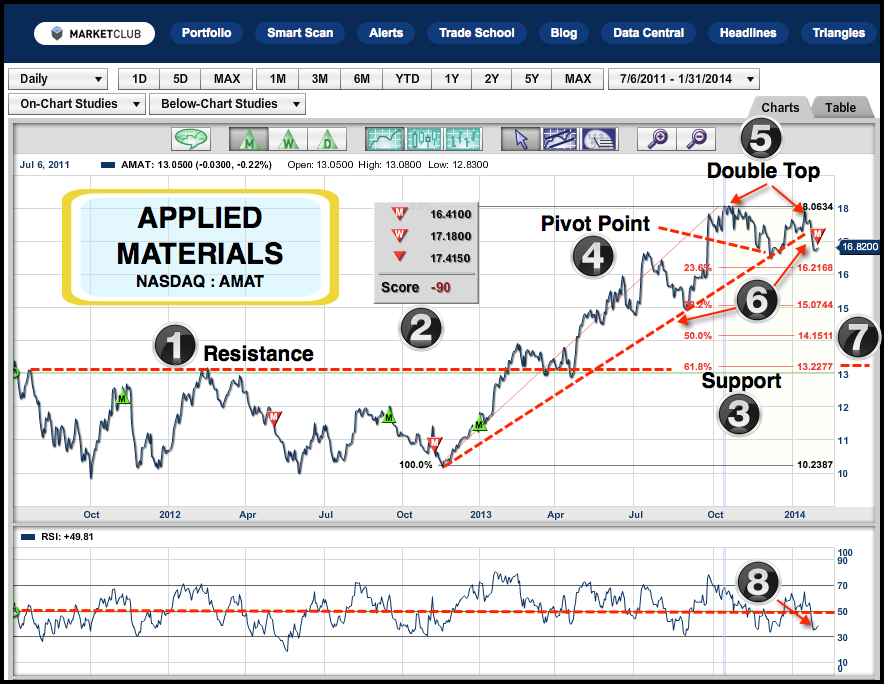
Here are the 8 technical aspects that could spell trouble for Applied Materials.
Chart Legend & Technical Picture (Black Numbers)
1. Major Resistance
2. All Trade Triangles are red and negative
3. Major support
4. Pivot point
5. Double top
6. Trend line and trend line break
7. Fibonacci retracement levels
8. RSI divergence with price action below 50
What Does This Company Do?
Applied Materials, Inc. (NASDAQ:AMAT) provides manufacturing equipment, services, and software to the semiconductor, flat panel display, solar photovoltaic (PV), and related industries worldwide.
To summarize, I expect the current (-90 Score) downtrend, in Applied Materials to continue. This outlook will only change if I see a change in the direction of the Trade Triangle technology.
If I am correct in my analysis, I could potentially see Applied Materials move down to the following Fibonacci retracement levels:
38.2% @ $15.07
50% @ $14.15
61.8% @ $13.22.
The 61.8% Fibonacci level of $13.22 also fits in nicely to the previous resistance level. The level of $13.22 should now act as support for this stock.
The double top/pivot point measurement if broken at the $16.40 level, indicates a move down to $15.00, which is very close to the 38.2% Fibonacci retracement level of $15.07 shown on the chart. These two measurements confirm one another and make a compelling case for this stock to trade lower in the weeks and months ahead.
Every success with MarketClub,
Adam Hewison
President, INO.com
Co-Creator, MarketClub
AMAT seemed to reverse almost immediately after hitting the monthly red triangle, turning back to green within 10 trading sessions. HAL also did a quick turn around and though still red monthly is getting close to its previous high. As a long term trader using monthly triangles it is very hard to hang in there when the stock seems to be resuming its previous positive trend. I suppose the medium and short term traders have similar thoughts. The handwriting seems to be on the wall but the triangle hasn't changed yet. Any comment on this trader's dilemma ?
AMAT looks like a good inversely correlated chart with the gold price, I should think?
One chart that I was a little surprised that didn't work out since yields rose was the TBT. I am wondering if rising yields really were much to be concerned about in the end.
The chart I'm watching now is the VXX. Very heavy volume there. Another that I was watching off and on, but over the very long term was the ¥.
Thanks again, A.H.!
Adam, very good analysis !! But what about HAL ??? did the Trade Triangle reverse ?
Thanks for your education.