Important Technical Indicators For Trading Binary Options

Vinz de la Fuente - INO.com Contributor - Binary Options


Trading Accordingly

Binary Trading could be simple to trade, but the difficulty comes up with how you will win your trade by knowing which direction you will choose. Traders can actually have a higher chance of winning every trade by simply knowing and applying some technical indicators whenever they trade in the market. Technical indicators can help identify price patterns and historical market behavior on market charts. Most of the traders are plainly looking at the wider trends in the market and then they will trade according to the direction of the trends, but sometimes success in using this is not assured.

The Technical Indicators

The technical indicators listed below are used widely in the market and have proven to be effective in some traders perspective. However, there is no 100% guarantee that it will be effective in every trading activity and it also has time-frame factors to be considered. Continue reading "Important Technical Indicators For Trading Binary Options"

Here's A Stock That Technically Taxes The Mind And Looks Great

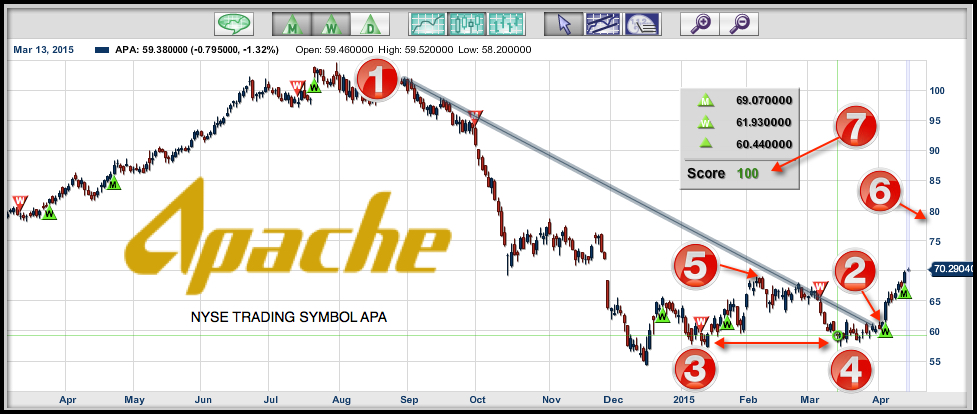
I found this stock using the Smart Scan technology and wanted to share it with you today. The stock is Apache Corp. (NYSE:APA).

I'm looking at this market on a technical basis as all of Trade Triangles are now positive and showing an upward trend.

As you can see on the chart, I have labeled numbers 1 through 7 so you can better understand exactly what you're looking at.

Continue reading "Here's A Stock That Technically Taxes The Mind And Looks Great"

How To Improve Your Trading In February

Hello traders and MarketClub members everywhere! Welcome to the new trading month of February.

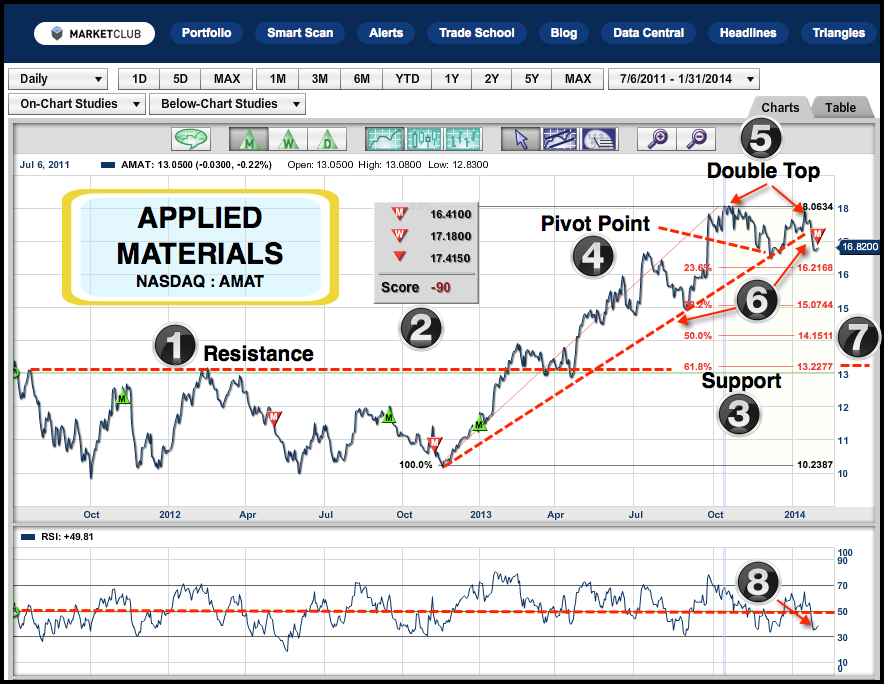
Today, I am going to do something a little bit different, I hope you enjoy the experience and find it educational and informative. To start with, I am going to analyze a static chart of the stock of Applied Materials, Inc. (NASDAQ:AMAT).

In addition to posting a single static chart on the blog, I am also going to be doing a video of that same chart. The video is short, to the point, and explains how I analyze stocks using the tools in MarketClub.

Today's in-depth analysis of Applied Materials shows a confluence of technical indicators that do not add up to a positive outlook for this stock. Remember, any analysis I do at MarketClub should not be considered a recommendation or an endorsement to buy or sell a particular security.

Click the chart to watch Adam's video analysis of Applied Materials Inc. (NASDAQ:AMAT)

There is an old adage in trading that goes like this, "they slide faster than they glide". Translated, that means stocks go down faster than they go up.

Here are the 8 technical aspects that could spell trouble for Applied Materials. Continue reading "How To Improve Your Trading In February"

Carl Icahn Buys 6% Stake In Talisman Energy (NYSE:TLM) - Should You Buy?

This morning as I was looking over the news, I read with interest that Carl Icahn had taken a 6% stake in Talisman Energy Inc (NYSE:TLM). Talisman Energy is a large Canadian energy company.

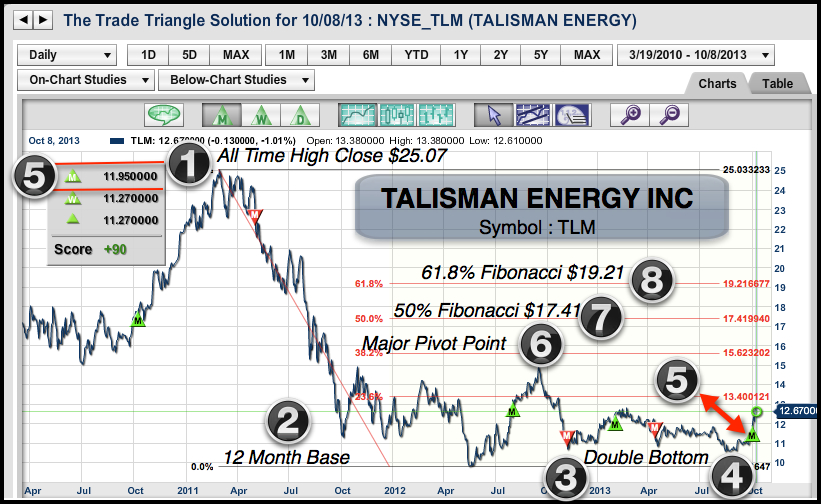
On October 1st, the Trade Triangles flashed a major buy signal for Talisman Energy at $11.95. I suspect that this was partly due to the price action that was reflected by Mr. Ichan's purchase of Talisman shares.

1.All Time High. (2) 12 Month Base. (3) +(4) Double Bottom. (5) Trade Triangle Buy at $11.95.

(6) Major Pivot Point. (7) 50% Fib Retracement $17.41. (8) 61.8% Fib Retracement $19.21.

What is also interesting is how Mr. Icahn picks stocks like Talisman Energy. I have witnessed the same actions in play in several other stocks that Mr. Icahn has purchased in the past 12 months. Stocks like Apple, Netflix, Herbalife, and most recently, Talisman, all display similar characteristics. I suspect that the technicals play a part in his overall approach to the market. The timing of Mr. Icahn's stock purchases are amazingly close to the timing of our Trade Triangle buy signals.

Today, we are looking at a chart of Talisman Energy and the stock action looks good from a technical viewpoint, as well as from our Trade Triangles. The potential for this market to go significantly higher is there, in my opinion. Of course, I will be using our Trade Triangles for money management to exit this position, should it not work out the way I expect it to.

As always, please share your thoughts with us on this or any other market.

Adam Hewison
President, INO.com
Co-Creator, MarketClub

How to Determine Where the Real Support and Resistance is Everyday

Larry Levin is no novice to the markets, in fact he's a pretty well-known by traders worldwide. We've asked Larry to give Trader's Blog readers some tips he uses to find daily support and resistance levels and he gladly agreed. Be sure to comment and let us know what you think and some things you use to find key market levels.

---------------------------------------------------------------------------------------------------------------------------------------------------

Secret Trading Tip #29
From the Desk of S&P Trader Larry Levin, President of Trading Advantage LLC

How to Determine Where the Real Support and Resistance is Everyday

Understanding support and resistance levels is an extremely important skill in any market, and it's absolutely critical if you plan on trading the S&P and NASDAQ E-Mini markets. Professional floor traders are aware of an entire range of major and minor support and resistance levels before the market opens each day. They also know how to calculate new levels as the trading day progresses. Continue reading "How to Determine Where the Real Support and Resistance is Everyday"