
For the past nine weeks, the Dow and S&P have been repeating a pattern that if repeated this week, will spell trouble for the markets. The market has been going up and down in a somewhat regular fashion. If you look at a weekly chart of the Dow and S&P, you can see that they have not had two consecutive weeks closing in the same direction, either on the downside or the upside.
Last week we saw the indices close higher for the week and if the pattern repeats, this should be a down week with a lower weekly close.
Here are the key levels to watch today. Should these levels be broken, I would expect the markets to accelerate to the downside.
DOW (INDEX:DJI) 16,200
S&P 500 (CME:SP500) 1,937
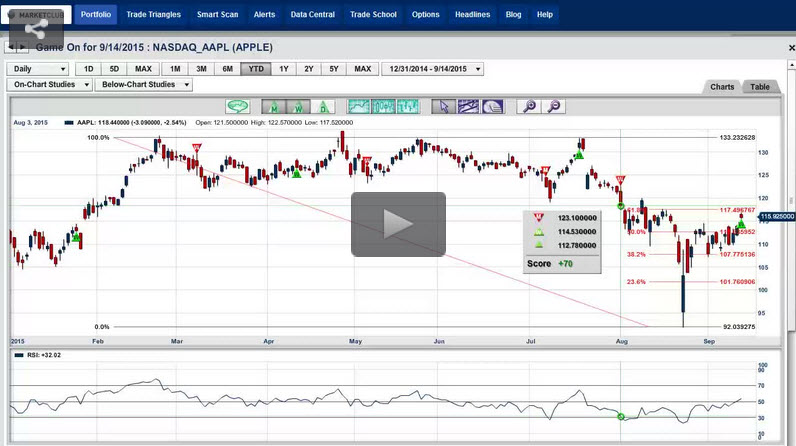
NASDAQ (NASDAQ:COMP) 4,746
With the Chinese market breaking its previous support today, I expect that that will rub off onto the US market and put pressure and uncertainty back in the market.
If that was not enough, on Thursday we find out if the Fed will raise interest rates. I somehow doubt they will, but who knows? Even the Fed doesn't know what it wants to do and they are now trapped between a rock and a hard place as nobody in the Fed knows what to do. They're not even close to a unanimous decision to hike rates or to leave them alone. Usually in bureaucratic situations like this when you have no consensus or clear direction, nothing gets done and gets put off for another day. That's what I suspect will happen.
When I scanned the markets late on Friday looking for new uptrends or green monthly Trade Triangles that met my criteria (stocks trading over 2 million shares a day), I found zero. This was not a good sign, in my opinion, for the general market.
Looking at the gold market which has been largely abandoned by investors, I see nothing but red Trade Triangles indicating that the line of least resistance is on the downside.
The euro is a different picture as all the Trade Triangles are green indicating a positive trend for this currency versus the US dollar.
Crude oil looks as though it is creating a pattern to move higher and I will discuss that today along with all the other markets.
This is going to be a tumultuous week in the markets. As I said earlier, if the weekly pattern persists as it has for the last nine weeks, this is going to be a negative week for stocks and the market in general.
There are going to be lots of opportunities this quarter, the key is to stay disciplined and be patient while these opportunities materialize and set themselves up.
Every success with MarketClub,
Adam Hewison
President, INO.com
Co-Creator, MarketClub
Adam..... yes this helps me to understand it.
One question left over. Are the T-30 years Bonds the same as iShares 20+ Year Treasury Bond ETF (TLT US A) ?? Thus T-Bonds are Treasury Bond???
Thanks for your great help, and.... have a very good weekend.
Kindly greetings,
Geurt.
Thanks for responding Adam.
I mean the: iShares 20+ Year Treasury Bond ETF (TLT US A) Last 119.17-0.08 (-0.07%)
Like to hear from you soon again if possible.
Greetings Geurt.
Geurt,
Looking at iShares 20+ Year Treasury Bond ETF (TLT US A) I came up with this scenario. 1. the market is below the RSI resistance line. 2. It's in a trading range with a score of 55. 3. Long-term trend is positive. 4. If the market moves over 123.50 I would be a buyer, otherwise I would be on the sidelines.
I would only buy this market if and when it moves over the 123.50 level. I hope this helps and answers your question.
Every success using MarketClub.
Adam
Thanks for your e-mail Adam.
I have a question: How looks TLT-charts?
Is this a buy or sell?
Look really forwards for your respons.
Greetings,
Geurt Hoekman.
Geurt,
Which TLT are you referring to?
Thanks,
Adam