

Chart 1. Platinum Monthly: Roller-Coaster
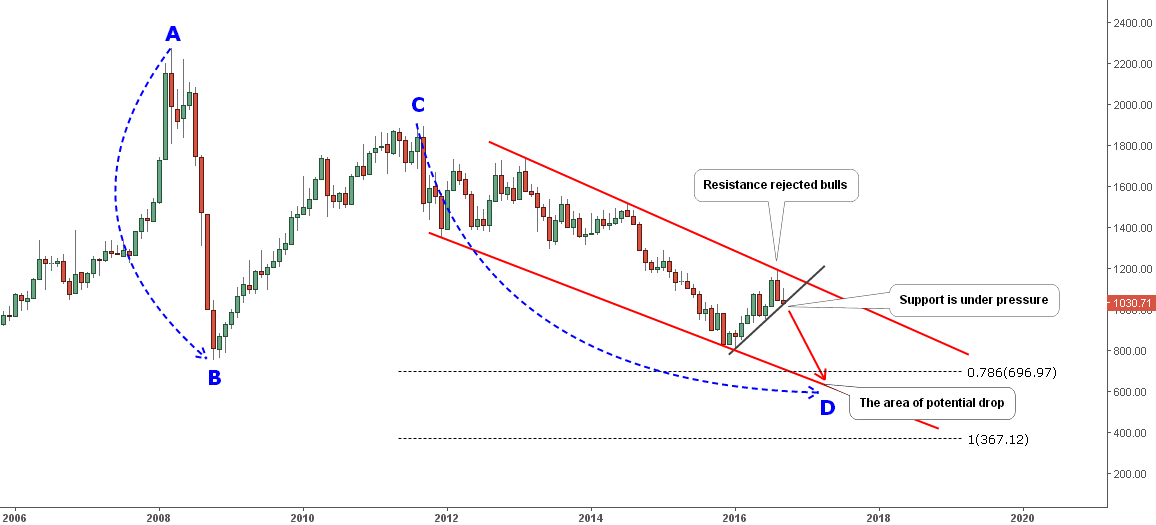
Chart courtesy of tradingview.com
Platinum booked an almost 50% gain from the bottom at $811 level in January 2016 to the top at $1194 level last month as falling crude oil spurred the demand for cars especially with large engines which in its turn lifted the demand for catalysts. As you can see, there is always a winner if there is a loser.
Those magical days for the metal are gone the same peak month in August, and the price painfully lost $150 from the top as the price was rejected by the upper side of the red multi-year downtrend. This month we can see that the market was trying to climb back to the upside as the candle has a long upper wick but failed to grasp the gains and slid down to the black vertical support. The price has started to drill it already, and it’s highly probable that we can witness the break this month. The break and close below $1020 would confirm the break. The next stop could be only at the June’s low at the $952 mark where the metal would lose one digit and will only have a 3-digit price.
The AB/CD concept has a too low target if the CD would hit the distance of AB segment at the $367 level. I added a fractional 0.786 Fibonacci distance of the AB segment for the CD segment, and it fits well with the downside of the red channel. The target for this drop is anticipated in the $600-700 area. The risk of upside can materialize only above the $1200 level.
Chart 2. Stillwater Mining Company Monthly: Death Or Rebirth?
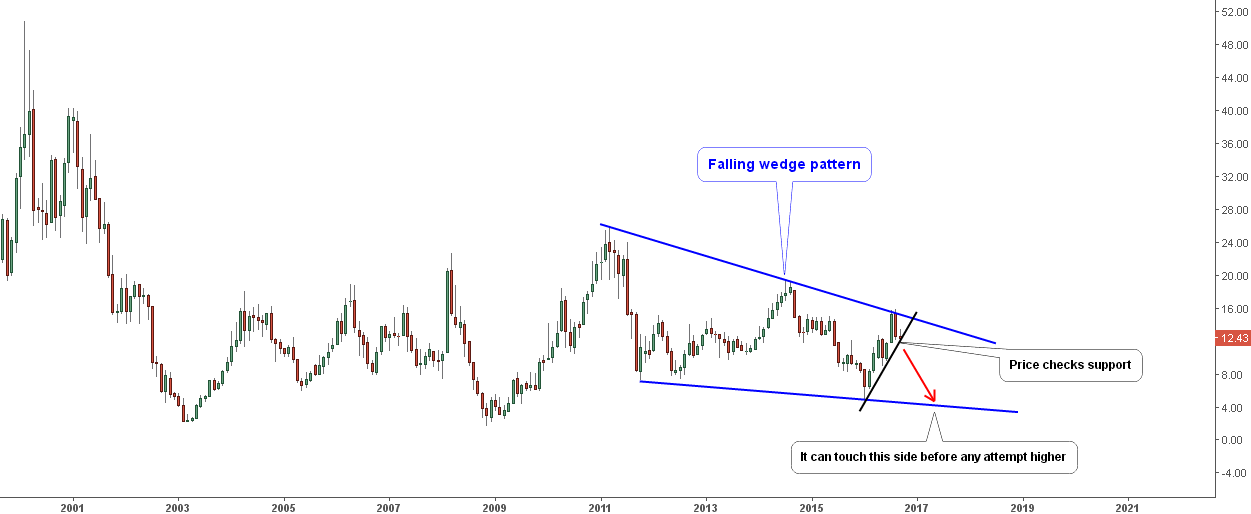
Chart courtesy of tradingview.com
I took the chart of Stillwater Mining Company (NYSE:SWC) to see if it has the same risks as does the metal. It is the only platinum group metals producer in the USA, and it is the largest producer of platinum anywhere outside of South Africa or Russia.
The price chart looks like a diagram of an earthquake as after wide amplitude moves we can see fading aftershocks of less power. The price had hit the all-time high at $50.81 in distant 2000, and then the price crashed heavily down. It is a textbook example of the life cycle of the company. It looks like we are at the stage when the company can either restart its business or just fall in a non-existent.
There are two factors; one is bad, and one is good. The bad thing for the stock is that like platinum the share price is checking the black support and it can break below it heavily to the downside of the blue Falling Wedge pattern around $4 mark. And the good thing is that if this pattern proves to be valid we can see the reversal upside from the lows, but it is the subject of the future posts. The price should stay above the $1.76 major low to keep the pattern intact.
Intelligent trades!
Aibek Burabayev
INO.com Contributor, Metals
Disclosure: This contributor has no positions in any stocks mentioned in this article. This article is the opinion of the contributor themselves. The above is a matter of opinion provided for general information purposes only and is not intended as investment advice. This contributor is not receiving compensation (other than from INO.com) for their opinion.