
Today I want to start off by thanking the brave men and women who have and continue to serve and protect our country. Thank you for all that you do!
Let's look at two very well-known and some would say mighty stocks. Both of these stocks are households names and have proven to be safe investments over time. The question now is, is that dynamic changing or has it changed already? Let's get started by looking the first stock.
Alphabet Inc. (NASDAQ:GOOG): For the first time in a long time Alphabet triggered a major sell signal which pushed all of the Trade Triangles into a negative mode. The first indication that there was trouble afoot for GOOG came on November 2 when the weekly Trade Triangle gave a red exit signal at $773. Is GOOG a buy here or is this once mighty stock headed lower?
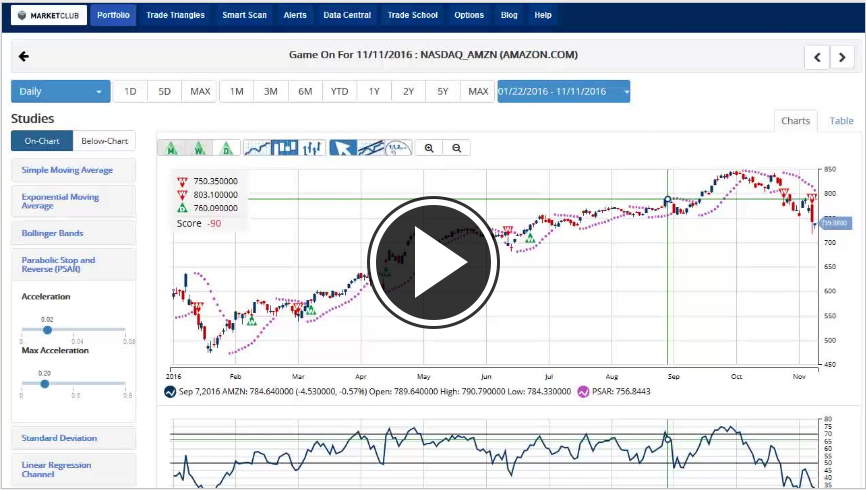
Even the mighty Amazon succumbed to selling pressure pushing all of the Trade Triangles in a negative mode and has dropped over $100 in the last four weeks. So has the mighty Amazon finally reached its zenith or is this a buying opportunity?
Amazon.com Inc. (NASDAQ:AMZN): For the first time in a long time Amazon gave a major sell signal which pushed all of our Trade Triangles into a negative mode. The first warning that Amazon was having problems was on 10/28 when the weekly Trade Triangle gave a red exit signal at $803.10. Since that time Amazon has dropped over $50. The question is can Amazon redeem itself before the holiday season gets into full swing?
Let's move on; it's Friday and the big winner for the week is the DOW which is up 5.14% for the week. The big loser for the week so far is gold which is down 3.29%. Let's examine how the Trade Triangles are positioned on both of these markets as well as some other markets.
DOW (INDEX:DJI) +5.14%: All Trade Triangles are Green - indicating a positive trend.
Gold (NYMEX:GC.Z16.E) -3.29%: All Trade Triangles are Red - indicating a negative trend.
S&P 500 (CME:SP500) +3.95%: Monthly Trade Triangle Red, Weekly Trade Triangle Green indicating a sidelines position.
NASDAQ (NASDAQ:COMP) -0.35%: Monthly and weekly Trade Triangles Red indicating a short position.
Crude Oil (NYMEX:CL.Z16.E) -.64%: Weekly and daily Trade Triangles Red indicating a short position.
I will be examining each of the above markets listed above and time permitting we will be looking at some stocks that are making 52 week highs.
Stay focused and disciplined.
Every success with MarketClub,
Adam Hewison
President, INO.com
Co-Creator, MarketClub