

In the past two weeks, crude oil futures took a beating; WTI futures ended last week at $46.47 per barrel while futures for Brent crude, the global benchmark, closed at $49.47 per barrel. Both WTI and Brent contracts have now concluded a 15% and 16% fall from their respective peak prices, closing at their lowest point since the deal between OPEC oil producers and 13 non-OPEC oil producers was signed. And the outlook for oil is not encouraging as a broader analysis of both the fundamentals and technical at play reveal a worrisome pattern—a pattern of an oversupplied oil market, ready to nose dive, as it did in 2014.
At the heart of the matter, as in 2014, is the US shale oil industry. Only this time around the US shale industry is significantly more competitive. According to Ron Ness, president of the North Dakota Petroleum Council quoted by Reuters, “the cost of extracting oil at Dunn County, North Dakota, is as low as in Iran” and “the cost of producing a barrel of oil is at $15 and falling" That figure is truly nothing short of dramatic! True, the production cost at Eagle Ford and Permian Delaware facilities is higher than Dunn country. And yet this figure underpins a very important change. In the next oil slump, shale producers won't be under the same pressure to cut production. Meanwhile, oil production in America has risen to 9.29 million barrels a day and is expected to surge to 10 million barrels a day by 2018. All the while, crude oil inventories are stubbornly high. The latest data from the EIA shows crude oil inventories were at 527.8 million barrels, at the higher end of the 5-year range. In fact, as the EIA chart below shows, US crude oil inventories have been persistently above the 5-year range for some time, suggesting demand for crude in the United States is too weak to accommodate the rising supply from shale oil.
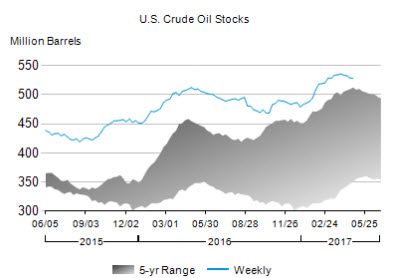
Chart courtesy of US Energy Information Administration
Meanwhile, In The Middle East
As US shale producers become leaner and with upscaling production, tensions in the Middle East refuse to abate. The region, home to OPEC’s major producers such as Saudi Arabia, Iraq and Iran, is in turmoil. Shiite Muslims and Sunni Muslim are engaged in a bloody religious war over dominance in the region. This has led Saudi Arabia, primarily Sunni Muslim, to rage a proxy war in Syria, the region’s hot spot, with predominantly Shiite Iran. And, as if this were not enough, Russia, the world’s largest oil producer and a critical party in the OPEC agreement, has jumped into this hot spot, actively fighting with its regional ally Iran.
Back in 2016, the parties involved had only just reached an agreement to curb oil production and, in fact, were only able to reach an agreement after an utter meltdown in oil prices. But, with US production at 9.29 million barrels a day and rising, more production cuts are required to keep oil price from re-testing its lows.
But, with the hostility between Saudi Arabia and Russia, and Saudi Arabia and Iran, it is difficult to see members agreeing to oil production cuts before another oil collapse. After all, curbing oil production is also a hot button political topic in oil producing countries. Curbing oil production usually means job cuts and less revenues over the short term and, with the economies of Iran, Russia and even Saudi Arabia in the doldrums, not one nation can really afford to curb oil production and none wants it. Unless, of course, oil prices take another serious hit.
As can be seen in the EIA chart below, global demand for oil is slightly higher than supplies in the periods when global inventories were falling. However, US production is set to rise further and, according to the EIA, demand is expected to stagnate. Keep in mind oil inventories are poised to rise, not just in the US, but also the rest of the world. And only another oil crash, perhaps even a re-test of the 2016 low, will bring the oil producing enemies to negotiate further cuts. And as for the technical? The double top in the WTI futures chart below is another strong indicator of the oil rally ending, and an oil correction, perhaps even a price meltdown all the way to $26, is in the making.
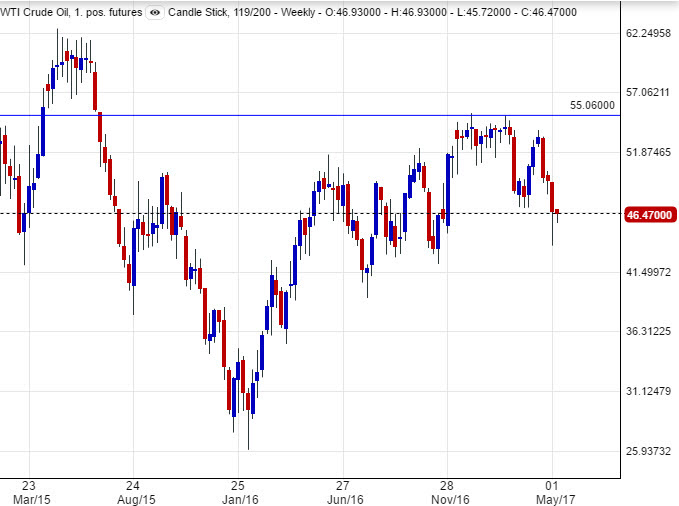
Chart courtesy of Netdania
Look for my post next week.
Best,
Lior Alkalay
INO.com Contributor
Disclosure: This article is the opinion of the contributor themselves. The above is a matter of opinion provided for general information purposes only and is not intended as investment advice. This contributor is not receiving compensation (other than from INO.com) for their opinion.
I really appreciate the detailed & unbiased analysis. Another cause of introduction of electric vehicles in India and china could further add to the glut of oil.
WRT your comment... "Meanwhile, shale oil production in America has risen to 9.29 million barrels a day and is expected to surge to 10 million barrels a day by 2018.", it is actually misleading it that it implies US shale production is 9.29 MB.
There are other US oil production sources that contribute to the 9.29 MB. For example, an increase in the GOM oil production has been a major contributor to the increased US production.
However, I do agree with your basic premise that oil will continue to be range bound.
first thank you for the insightful article.
It surely doesn't seem like oil will rise above 50 again for long time.
what happens to the mid stream markets the MLP's and such ?
if Oil falls below the 38-40 range which it does seem reality
according to the article just to much inventory ?
is it possible to have such an negative effect on all the markets ?
the markets could possible fall 15-20 % ?