
President Biden seeks to add enough supply to prevent near-term oil price spikes by releasing U.S. strategic petroleum reserves (SPR) of 15 million barrels. However, that might be offset by OPEC+’s two million barrels per day (bpd) output cuts.
Oil prices have seen significant volatility this year thanks to the Russia-Ukraine war. However, strong demand is expected to keep the energy market afloat. OPEC+ expects medium-term and long-term growth in energy demand.
According to the latest U.S. energy information administration’s (EIA) short-term energy outlook report, oil prices could get a boost from potential petroleum supply disruptions and slower-than-expected crude oil production growth.
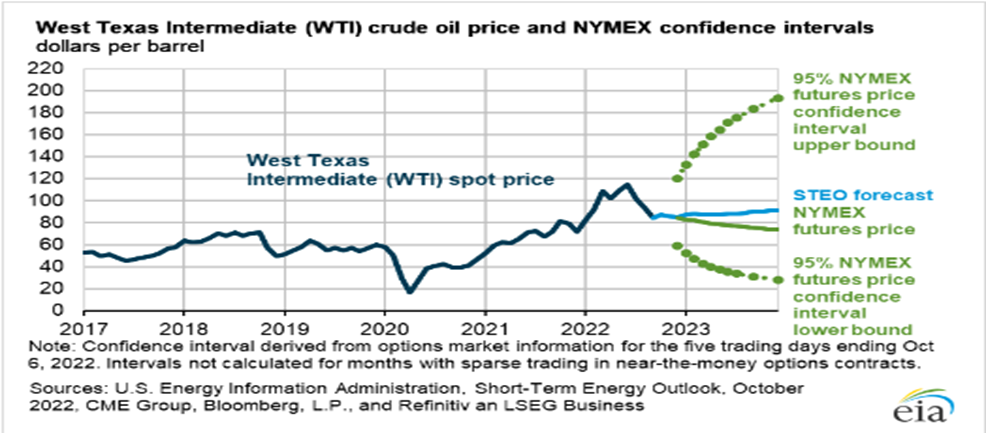
On top of it, Goldman Sachs’ head of commodities research Jeff Currie said that crude oil prices could . In addition, he said supply could get squeezed by several factors, like a stop on SPR releases, lack of drilling, and a European Union ban on Russian oil.
Given this backdrop, investing in ConocoPhillips (COP), Hess Corporation (HES), and Northern Oil and Gas, Inc. (NOG) might be prudent in light of several technical indicators.
ConocoPhillips (COP)
COP engages in the exploration, production, transportation, and sale of crude oil, bitumen, natural gas, and liquefied natural gas (LNG). The company has a $160.52 billion market capitalization.
The company’s revenue has grown at a 21.6% CAGR over the past three years, while its net income has advanced at a 30.6% CAGR over the same period. Its EPS has also grown at a 24.9% CAGR over the past three years.
COP’s total revenues and other income increased 115.3% year-over-year to $21.99 billion for the fiscal second quarter. Its adjusted earnings rose 196.4% from the prior-year quarter to $5.09 billion, while adjusted earnings per share of common stock improved 207.9% from the prior-year period to $3.91.
The company’s earnings were boosted primarily due to higher realized prices. Its total average realized price was $88.57 per barrel of oil equivalent (BOE), 77% higher than the year-ago value.
The consensus EPS estimate of $3.39 for the quarter ending December 2022 indicates a 49.3% year-over-year improvement. Likewise, the consensus revenue estimate of $18.73 billion reflects a rise of 17.4% from the prior-year quarter. Moreover, COP has topped consensus EPS estimates in each of the trailing four quarters.
COP is trading at a slight premium to its peers. In terms of its forward non-GAAP P/E, it is trading at 9.03x, 12.2% higher than the industry average of 8.05x. Its forward EV/Sales multiple of 2.22 is 16.8% higher than the industry average of 1.90.
The stock has gained 69.3% over the past year and 74.7% year-to-date to close its last trading session at $126.09. It is trading higher than its 50-day and 200-day moving averages of $113.77 and $101.41, respectively, indicating an uptrend.
MarketClub’s Trade Triangles show that COP has been trending UP for all three-time horizons. The long-term and intermediate-term trends for COP have been UP since October 7, 2022, while its short-term trend has been UP since October 13, 2022.
The Trade Triangles are our proprietary indicators, comprised of weighted factors that include (but are not necessarily limited to) price change, percentage change, moving averages, and new highs/lows. The Trade Triangles point in the direction of short-term, intermediate, and long-term trends, looking for periods of alignment and, therefore, strong swings in price.
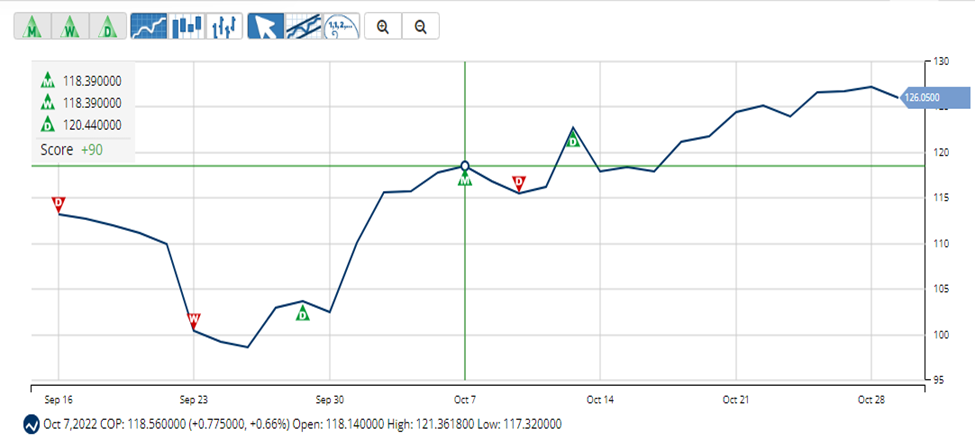
In terms of the Chart Analysis Score, another MarketClub proprietary tool, COP scored +90 on a scale from -100 (strong downtrend) to +100 (strong uptrend), indicating that the uptrend is likely to continue. While COP shows intraday weakness, it remains in the confines of a bullish trend. Traders should use caution and utilize a stop order.
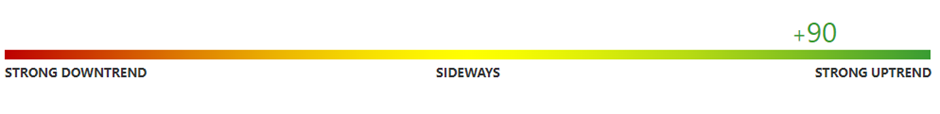
The Chart Analysis Score measures trend strength and direction based on five different timing thresholds. This tool considers intraday price action; new daily, weekly, and monthly highs and lows; and moving averages.
Click here to see the latest Score and Signals for COP.
Hess Corporation (HES)
With a market capitalization of $43.68 billion, HES operates as an exploration and production company that explores, produces, purchases, transports, and sells crude oil, natural gas liquids (NGLs), and natural gas. The company operates through its two broad segments of Exploration and Production; and Midstream.
Over the past three years, HES’ revenue has grown at an 18.2% CAGR, while its EBIT has grown at a 72.4% CAGR. Its EBITDA has advanced at a 22.7% CAGR over the same period.
HES’ total revenues and other non-operating income increased 74.3% year-over-year to $3.16 billion in the fiscal third quarter that ended September 30. Adjusted net income attributable to Hess Corporation and adjusted net income per common share improved 577.9% and 575% from the prior-year period to $583 million and $1.89, respectively.
The company realized a higher crude and NGL selling price. Results were also partly driven by net production (excluding Libya) of 351,000 BOE per day, buoyed by higher production in Guyana and the Bakken.
Analysts expect HES’ EPS to increase 137.6% year-over-year to $2.02 in the fiscal quarter ending December 2022. Likewise, Street expects the company’s revenue to rise 20.8% from the prior-year quarter to $2.72 billion. HES has beaten consensus EPS estimates in all four trailing quarters.
HES is trading at a premium, reflecting the expectations about its future performance. In terms of its forward P/E, it is trading at 19.05x, 109.9% higher than the industry average of 9.08x. Its forward Price/Book multiple of 5.32 is 171.7% higher than the industry average of 1.96.
Over the past year, HES’ stock has gained 70.9%. It has gained 90.6% year-to-date to close its last trading session at $141.08. It is trading higher than its 50-day moving average of $123.21 and 200-day moving average of $109.78.
Trade Triangles show that HES has been trending UP for all three-time horizons. The long-term and intermediate-term trends for HES have been UP since October 6, 2022, while its short-term trend has been UP since October 19, 2022.
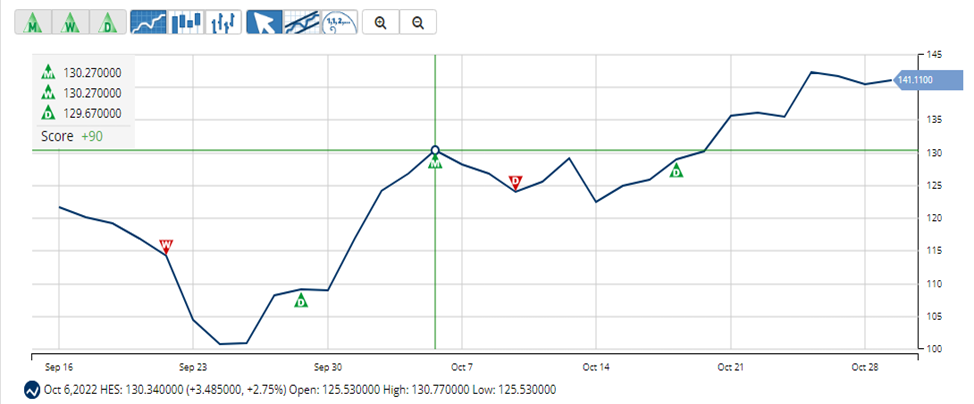
Regarding the Chart Analysis Score, HES scored +100 on a scale from -100 (strong downtrend) to +100 (strong uptrend), indicating that the uptrend is likely to continue. Traders should protect gains and look for a change in score to suggest a slowdown in momentum.

Click here to see the latest Score and Signals for HES.
Northern Oil and Gas, Inc. (NOG)
With a $2.69 billion market capitalization, NOG operates as an independent energy company that acquires, explores, develops, and produces crude oil and natural gas properties. The company primarily holds interests in the Williston Basin, the Appalachian Basin, and the Permian Basin in the United States.
Over the past three years, NOG’s revenue and net income have grown at 40.9% and 10% CAGRs, respectively.
For the fiscal second quarter ended June 30, NOG’s total revenues increased substantially year-over-year to $441.45 million. The company’s results were boosted by a record quarterly production of 72,689 BOE per day, reflecting an increase of 33% from the prior-year quarter.
Adjusted net income came in at $149.42 million, registering an increase of 129.8% from the prior-year period. Adjusted net income per common share rose 87% from the same period last year to $1.72.
Street EPS estimate of $2.01 for the quarter ending December 2022 indicates an 89.6% year-over-year improvement. Likewise, the Street revenue estimate of $434.05 million reflects a rise of 30.6% from the prior-year quarter.
NOG is trading at a discount. Its forward non-GAAP P/E multiple of 4.74 is 41.8% lower than the industry average of 8.15. In terms of its forward non-GAAP PEG, it is trading at 0.18x, 75.3% lower than the industry average of 0.74.
NOG’s shares have gained 47.4% over the past year and 65.9% year-to-date to close its last trading session at $34.14. It is trading higher than its 50-day moving average of $31.38 and 200-day moving average of $28.10.
Trade Triangles show that NOG has been trending UP for two of the three-time horizons. The long-term trend has been UP since October 19, 2022, while the intermediate-term trend has been UP since October 18, 2022. However, its short-term trend has been DOWN since October 28, 2022.
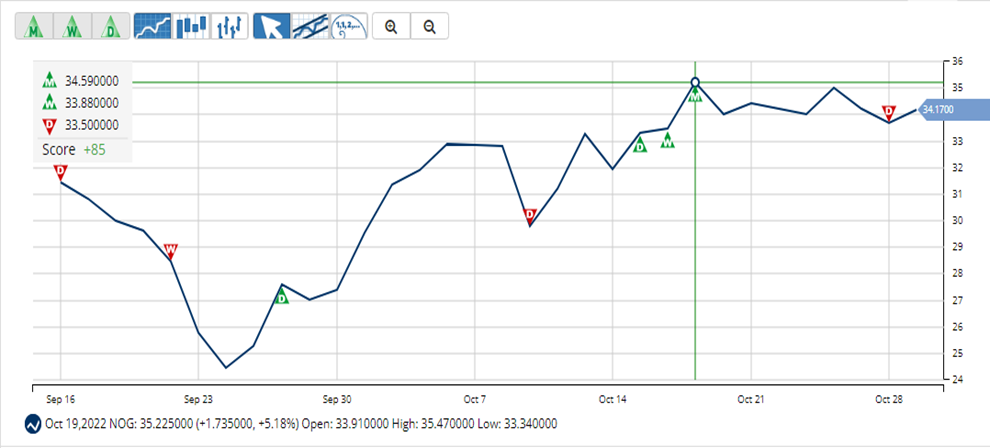
In terms of the Chart Analysis Score, NOG scored +85 on a scale from -100 (strong downtrend) to +100 (strong uptrend), indicating short-term weakness. However, look for the longer-term bullish trend to resume. As always, monitor the trend score and utilize a stop order.

Click here to see the latest Score and Signals for NOG.
What's Next for These Energy Stocks?
Remember, the markets move fast and things may quickly change for these stocks. Our MarketClub members have access to entry and exit signals so they'll know when the trend starts to reverse.
Join MarketClub now to see the latest signals and scores, get alerts, and read member-exclusive analysis for over 350K stocks, futures, ETFs, forex pairs and mutual funds.
Best,
The MarketClub Team
su*****@in*.com
Unlike the others, thank you for sharing a few! The others say, " click here for these tickers", just to learn they want to sell a subscription and that's after an hour of our time! Then after you pay you might learn the ticker symbols! Thanks, Rick