
After two quarters of subscriber declines and slowing growth, streaming major Netflix, Inc. (NFLX) bounced back in some fashion as it added more subscribers than analysts estimated in the third quarter. NFLX reported a net gain of 2.41 million subscribers, which was considerably higher than the average 1.1 million additions expected by analysts.
Amid rising competition from other streaming platforms, NFLX reported a subscribers decline of roughly 200,000 in the first quarter and 970,000 in the second quarter, leading its shares to nosedive.
The higher-than-expected subscriber addition in the third quarter surprised the market. NFLX shares jumped after the company’s results were announced on October 18, 2022.
NFLX has had a torrid time this year, with its stock declining 55.3% in price year-to-date to close the last trading session at $269.06. However, its shares have gained 12.6% over the past month.
The company comfortably beat Wall Street revenue and earnings estimates in the last reported quarter. Its revenue and EPS beat the estimates by 1.1% and 43.1%, respectively.
After a poor first half where The Walt Disney Company (DIS) overtook NFLX as the market leader, the company took up massive changes, such as introducing ad-supported streaming and cracking down on shared accounts. The company is also considering a cloud-gaming service.
In its letter to its shareholders, the company said that it expects 4.5 million new subscribers in the fourth quarter and expects its revenue to grow to $7.78 billion. Its subscriber guidance is higher than analysts’ estimates of 4 million.
In the shareholder letter, NFLX executives said, “After a challenging first half, we believe we’re on a path to reaccelerate growth.” The company debuted its advertising-supported tier in the United States, dubbed “Basic with Ads,” for $6.99 a month, which is below Disney’s ad-based price point of $7.99. It is expected to be launched in eleven other countries by November 10.
Moreover, as it looks to crack down on account sharing, the company, in its letter, said, “landed on a thoughtful approach to monetize account sharing, and we’ll begin rolling this out more broadly starting in early 2023.”
Here’s what could influence NFLX’s performance in the upcoming months:
Mixed Financials
NFLX’s revenues increased 5.9% year-over-year to $7.92 billion for the third quarter ended September 30, 2022. Its net income declined 3.5% year-over-year to $1.39 billion. The company’s EPS came in at $3.10, representing a decline of 2.8% year-over-year.
Its net cash provided by operating activities increased 576% year-over-year to $556.81 million. In addition, its non-GAAP free cash flow increased 544.1% year-over-year to $471.85 million. Also, its operating margin was 19.3%, compared to 23.5% in the year-ago period.
Mixed Analyst Estimates
Analysts expect NFLX’s EPS for fiscal 2022 to decline 8.2% year-over-year to $10.31. On the other hand, its revenue for fiscal 2022 is expected to increase 6.3% year-over-year to $31.58 billion.
Its consensus EPS and revenue estimates for fiscal 2023 of $10.69 and $33.87 billion indicate a 3.7% and 7.2% year-over-year increase, respectively.
Mixed Profitability
In terms of the trailing-12-month gross profit margin, NFLX’s 39.62% is 21.3% lower than the 50.32% industry average. Its 1.47% trailing-12-month Capex/Sales is 61.8% lower than the industry average of 3.84%.
On the other hand, its 18.16% trailing-12-month EBIT margin is 96% higher than the 9.27% industry average. Also, its 16.03% trailing-12-month net income margin is 234.6% higher than the 4.79% industry average.
Technical Indicators Show Promise
The recovery of NFLX remains uncertain, considering its mixed fundamentals, but the stock’s trends are promising, which traders could capitalize on.
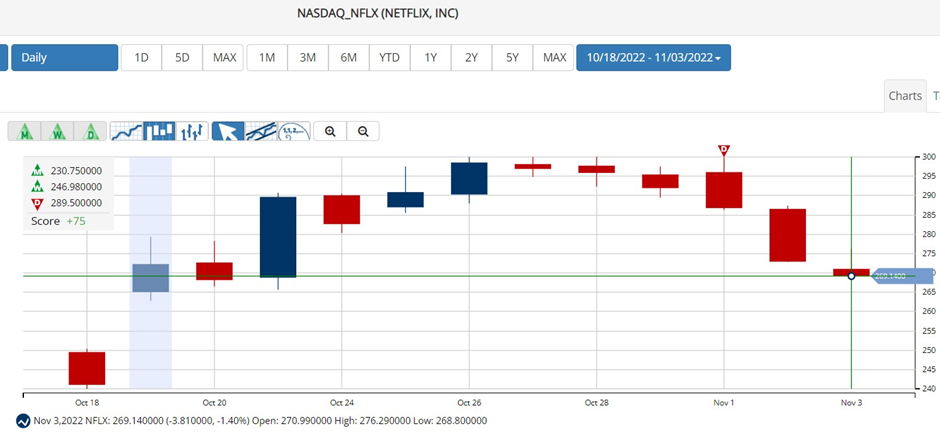
According to MarketClub’s Trade Triangles, the long-term trend for NFLX has been UP since August 4, 2022, and its intermediate-term trend has been UP since October 17, 2022. However, the stock’s short-term trend has been DOWN since November 1, 2022.
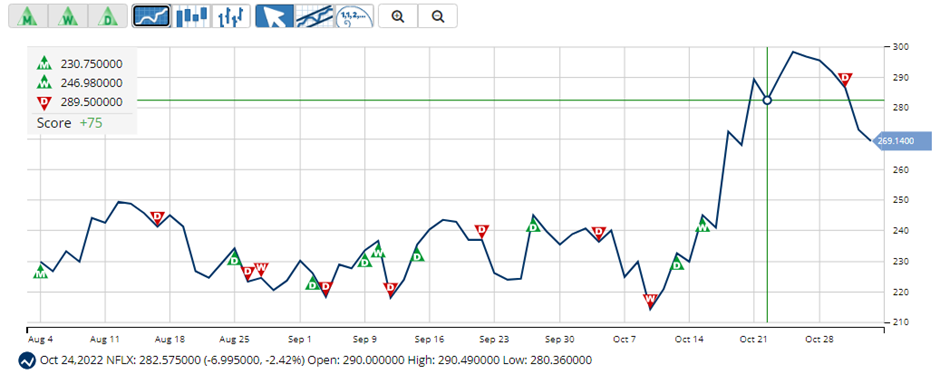
The Trade Triangles are our proprietary indicators, comprised of weighted factors that include (but are not necessarily limited to) price change, percentage change, moving averages, and new highs/lows. The Trade Triangles point in the direction of short-term, intermediate, and long-term trends, looking for periods of alignment and, therefore, intense swings in price.
In terms of the Chart Analysis Score, another MarketClub proprietary tool, NFLX scored +75 on a scale from -100 (strong downtrend) to +100 (strong uptrend), indicating Bull Market Weakness. While NFLX shows signs of short-term weakness, it remains in the confines of a long-term uptrend.

The Chart Analysis Score measures trend strength and direction based on five different timing thresholds. This tool considers intraday price action; new daily, weekly, and monthly highs and lows; and moving averages.
Click here to see the latest Score and Signals for NFLX.
What's Next for Netflix, Inc. (NFLX)?
Remember, the markets move fast and things may quickly change for this stock. Our MarketClub members have access to entry and exit signals so they'll know when the trend starts to reverse.
Join MarketClub now to see the latest signals and scores, get alerts, and read member-exclusive analysis for over 350K stocks, futures, ETFs, forex pairs and mutual funds.
Best,
The MarketClub Team
su*****@in*.com