
While it is broadly expected that the pace of interest rate hikes may be dialed down to 25-basis points, concerns over terminal interest rates being higher than expected and its effect on the U.S. economy have kept markets on edge.
With the likely less aggressive but drawn-out interest rate hikes by the Fed expected to add further stress to subdued corporate performance, the stock market volatility is expected to continue in the foreseeable future.
Hence, it could be wise for investors to increase exposure to instruments and assets whose prospects are robust enough to remain relatively unaffected by the turbulence.
With supply constraints due to turbulent geopolitics and extreme weather events acting to keep demand robust, global energy consumption is expected to grow by 1.3% in 2023 as many countries use fossil fuels to manage their energy transition.
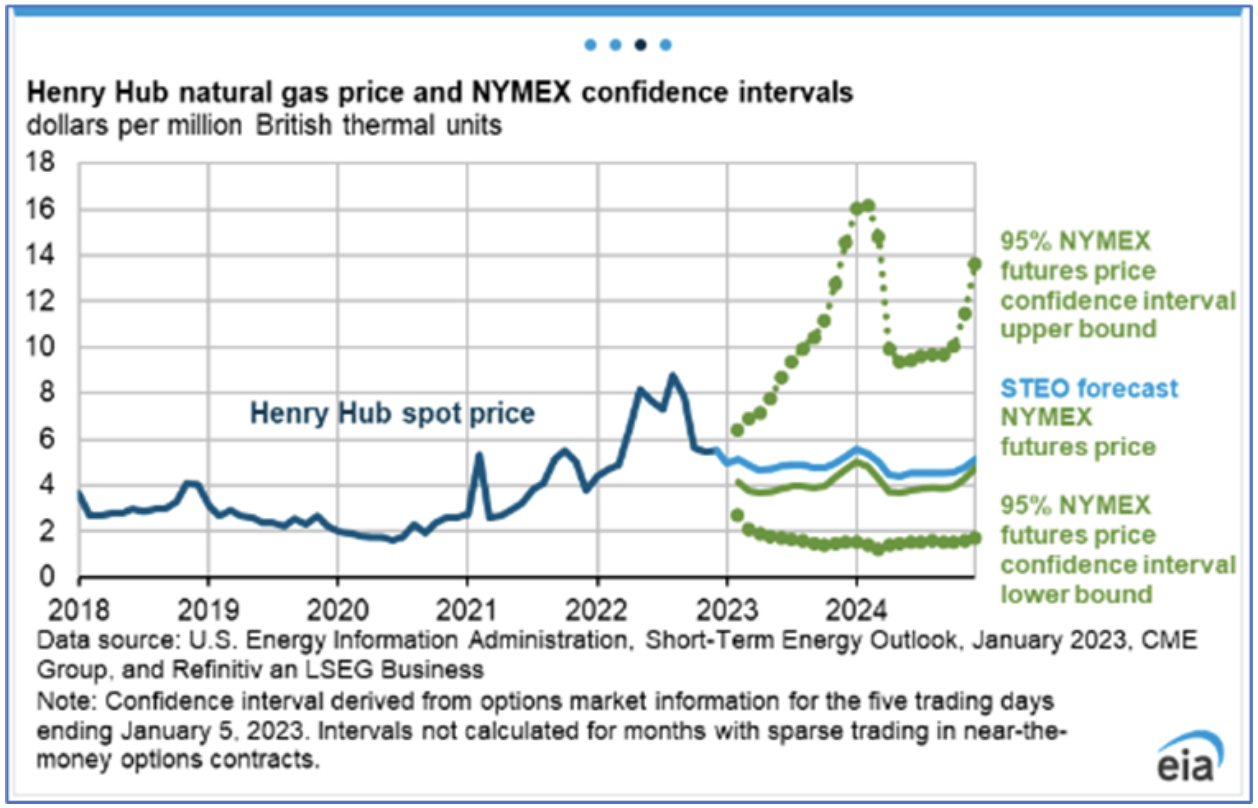
Besides, energy demand is expected to grow in the long run due to increased economic activity and the effects of climate change. The global energy as a service market is projected to grow at a 10.3% CAGR to reach $144 billion by 2028.
Hence, it would be opportune to load up on energy stocks Halliburton Company (HAL), Baker Hughes Company (BKR), and Camber Energy, Inc. (CEI) as some technical indicators point to their upside.
Halliburton Company (HAL)
HAL provides products and services to the energy industry. The company operates through two segments: the Completion and Production segment and the Drilling and Evaluation segment. Over the last three years, its net income and EPS have grown at 13.6% and 12.3% CAGRs, respectively.
During the third quarter of fiscal 2022, ended September 30, due to increased activity and pricing in North American and international markets, HAL’s total revenue increased 38.8% year-over-year to $5.36 billion, while its adjusted operating income increased 84.7% year-over-year to $846 million.
During the same period, the adjusted net income attributable to HAL came in at $544 million, or $0.60 per share, up 119.4% and 114.3% year-over-year, respectively.
HAL’s revenue and EPS for the fiscal ended December 2022 are expected to come in at $20.30 billion and $2.10, indicating increases of 32.7% and 94.4% year-over-year, respectively. The company has further impressed by surpassing consensus EPS in each of the trailing four quarters.
HAL is currently trading at a premium, indicating high expectations regarding the company’s performance in the upcoming quarters. In terms of forward P/E, HAL is presently trading at 20.32x, 149.1% higher than the industry average of 8.16x. Also, it is trading at a forward EV/EBITDA multiple of 11.53, compared to the industry average of 5.50.
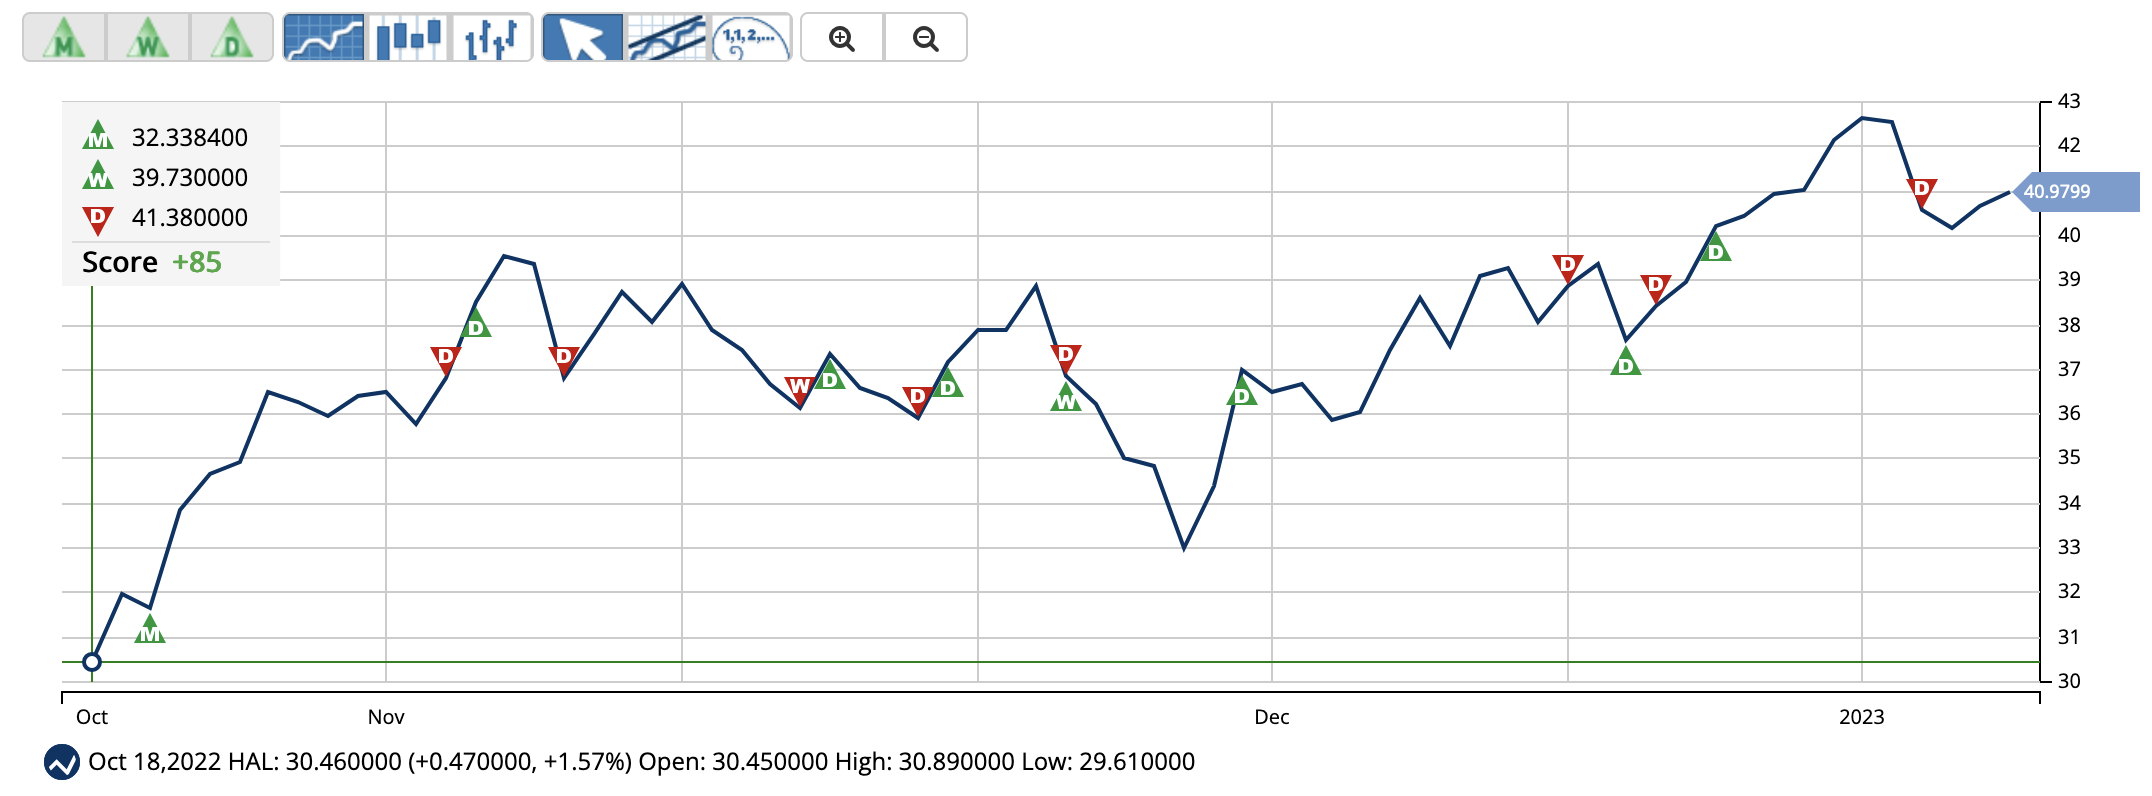
The stock is currently trading above its 50-day and 200-day moving averages of $37.79 and $34.05, respectively, indicating an uptrend. It has gained 17.7% over the past month and 50.7% over the past six months to close the last trading session at $42.66.
MarketClub’s Trade Triangles show that HAL has been trending UP for two of the three time horizons. The long-term trend for HAL has been UP since October 20 and its intermediate term trend has been UP since January 6, 2023, while its short-term trend has been DOWN since January 18, 2023.
The Trade Triangles are our proprietary indicators, comprised of weighted factors that include (but are not necessarily limited to) price change, percentage change, moving averages, and new highs/lows. The Trade Triangles point in the direction of short-term, intermediate, and long-term trends, looking for periods of alignment and, therefore, strong swings in price.
In terms of the Chart Analysis Score, another MarketClub proprietary tool, HAL scored +85 on a scale from -100 (strong downtrend) to +100 (strong uptrend), indicating that the longer-term bullish trend is likely to resume. Traders should continue to monitor the trend score and utilize a stop order.

The Chart Analysis Score measures trend strength and direction based on five different timing thresholds. This tool takes into account intraday price action, new daily, weekly, and monthly highs and lows, and moving averages.
Click here to see the latest Score and Signals for HAL.
Baker Hughes Company (BKR)
BKR is an energy technology company that operates through three segments: Oilfield Services (OFS); Oilfield Equipment (OFE); Turbomachinery & Process Solutions (TPS); and Digital Solutions (DS). BKR’s revenue grew at a 6.8% CAGR over the past five years.
For the fiscal 2022 third quarter, ended September 30, 2022, BKR’s revenue increased 5.4% year-over-year to $5.37 billion. During the same period, driven by higher volume and pricing with all segments expanding their margins, the company’s adjusted operating income and adjusted EBITDA increased 25.1% and 14.2% year-over-year to $503 million and $758 million, respectively.
The adjusted net income attributable to BKR for the quarter came in at $264 million or $0.26 per share, up 87.2% and 62.5% year-over-year, respectively.
Analysts expect BKR’s revenue and EPS for the fiscal year ended December 2022 to increase 3.9% and 46.6% year-over-year to $21.33 billion and $0.92, respectively.
In terms of forward P/E, BKR is currently trading at 34.24x compared to the industry average of 8.16x. Similarly, its forward EV/EBITDA multiple of 11.81 is greater than the industry average of 5.50.
BKR’s stock is currently trading above its 50-day and 200-day moving averages of $29.27 and $28.91, respectively, indicating a bullish trend. It has gained 7.9% over the past month and 31.6% over the past six months to close the last trading session at $31.63.
MarketClub’s Trade Triangles show that BKR has been trending UP for two of the three time horizons. The long-term and intermediate-term trends for BKR have been UP since November 1, 2022, and January 3, 2023, respectively, while its short-term trend has been DOWN since January 18.

In terms of the Chart Analysis Score, another MarketClub proprietary tool, BKR scored +75 on a scale from -100 (strong downtrend) to +100 (strong uptrend), indicating short-term weakness. However, the stock still remains in the confines of a long-term uptrend.

Click here to see the latest Score and Signals for BKR.
Camber Energy, Inc. (CEI)
CEI is an independent oil and natural gas company. It is engaged in the acquisition, development, and sale of crude oil, natural gas, and natural gas liquids and manufacturing and supplying industrial engines, power generation products, services, and custom energy solutions.
During the third quarter of the fiscal, ended September 30, 2022, CEI’s revenue increased 53.6% year-over-year to $158.51 thousand. During the same period, the company’s net loss attributable to common shareholders narrowed to $23.28 million or $0.05 per share, compared to $264.56 million or $1.63 during the previous-year quarter.
CEI’s total liabilities stood at $70.60 million as of September 30, 2022, compared to $118.22 million as of December 31, 2021.
CEI’s stock is trading at a premium compared to its peers. In terms of trailing-12-month EV/EBITDA, CEI is trading at 107.02x, compared to the industry average of 1.98x. Also, it is currently trading at a forward Price/Sales of 22.97x, compared to the industry average of 1.38x. It closed its last trading session at $1.90.
MarketClub’s Trade Triangles show CEI has been trending UP for each of the three time horizons. The long-term trend for CEI has been UP since December 21, 2022, while its intermediate-term and short-term trends have been UP since December 19, 2022, and January 20, 2023, respectively.
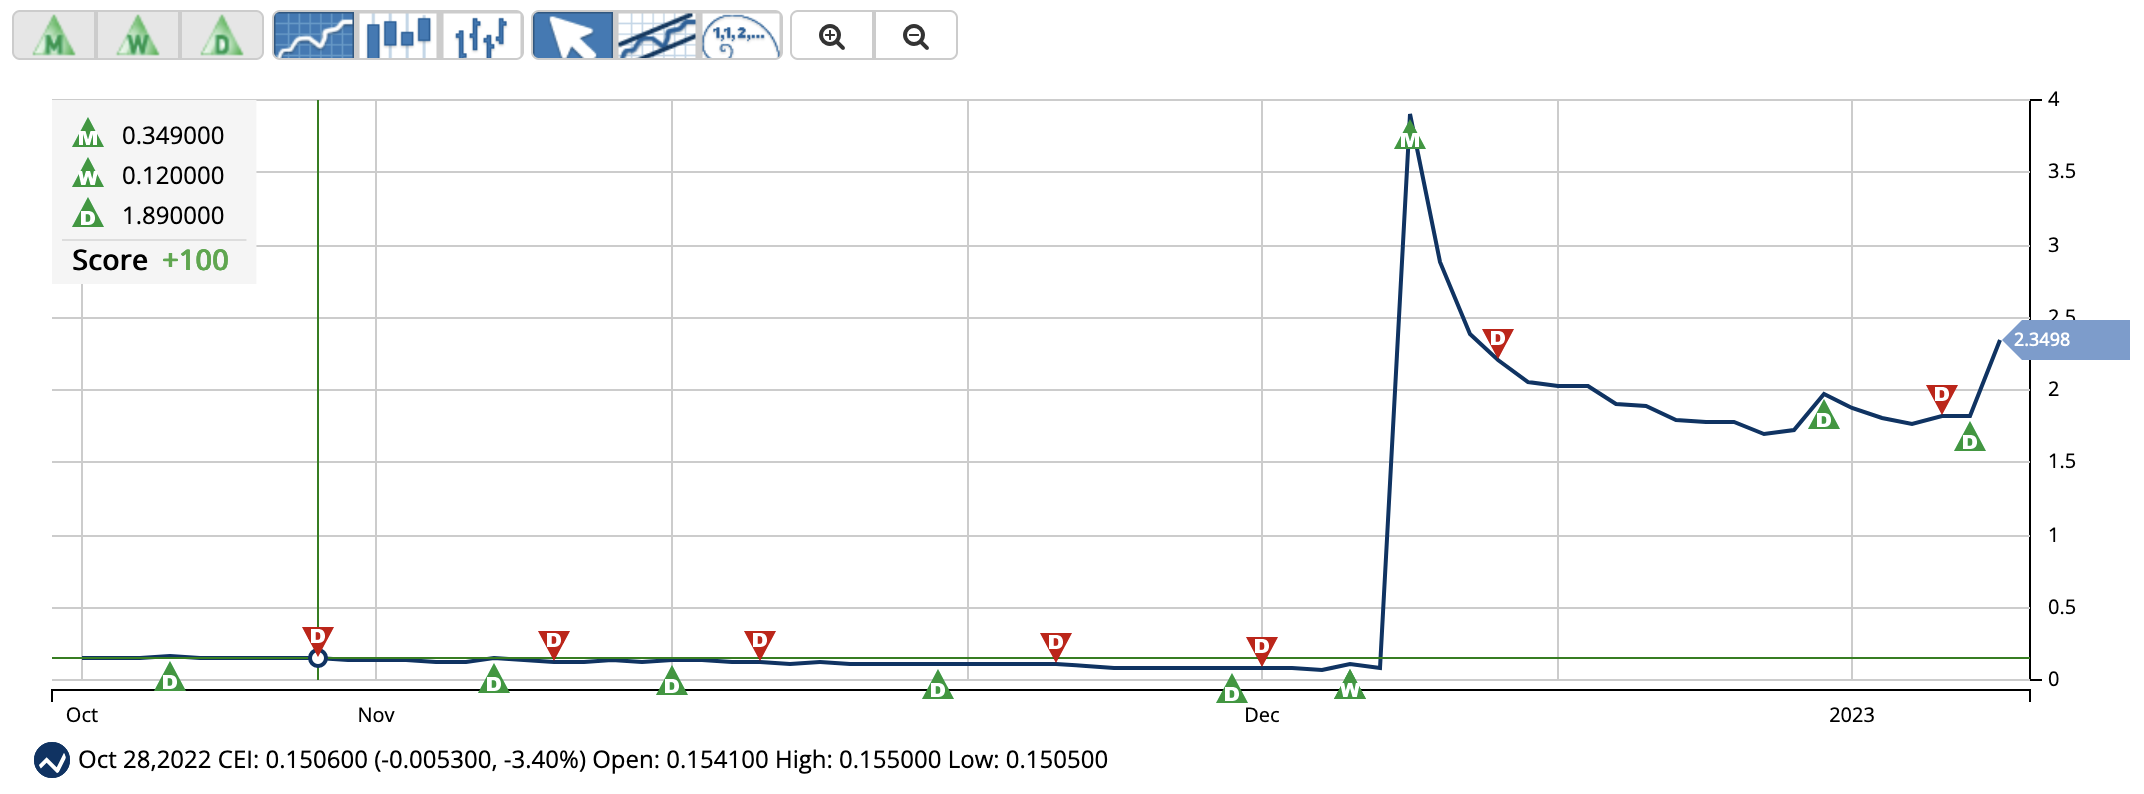
In terms of the Chart Analysis Score, another MarketClub proprietary tool, CEI scored +100 on a scale from -100 (strong downtrend) to +100 (strong uptrend), indicating that the uptrend will likely continue. Traders should protect gains and look for a change in score to suggest a slowdown in momentum.

Click here to see the latest Score and Signals for CEI.
What's Next for These Energy Stocks?
Remember, the markets move fast and things may quickly change for these stocks. Our MarketClub members have access to entry and exit signals so they'll know when the trend starts to reverse.
Join MarketClub now to see the latest signals and scores, get alerts, and read member-exclusive analysis for over 350K stocks, futures, ETFs, forex pairs and mutual funds.
Best,
The MarketClub Team
su*****@in*.com