
Last month I shared with you my concern about the possible reversal of the index in spite of the solid gain booked earlier. The chart of the S&P 500 spoke for itself, showing a weakness in the structure of the move up. The angle of the uptrend was too gentle to sustain. And the finishing punch came from the RSI indicator, which had an invisible Bearish Divergence on its chart.
We never know what the future will bring us, although this time the geometry of the double resistance worked just perfect as I assumed another spike to that area of $2860 before a reversal in my earlier post. Bingo! The index peaked right in that area at the $2863 and then collapsed. This is further proof of the magic power of the trends.
Chart: S&P 500 Daily: Watch Support After The Failure At The Resistance
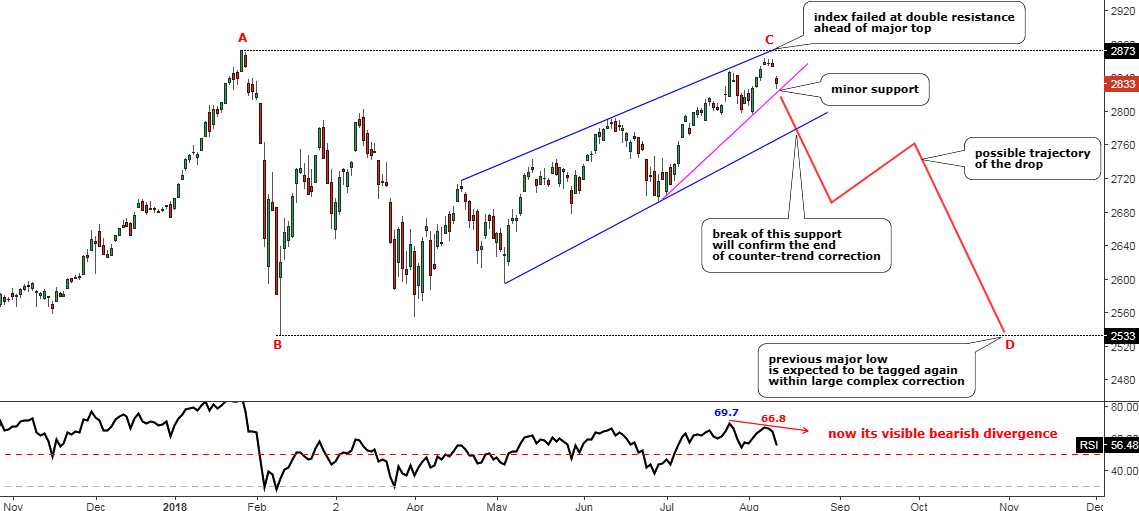
Chart courtesy of tradingview.com
This is an updated chart above, which reflects the market changes and shows the outlook of the possible upcoming behavior of the S&P 500.
First of all, I changed the labels of segments after the index failed at the double resistance ahead of the major top and reversed to the downside. Now we should focus on the global picture, and I marked the first drop within the large, complex correction as a red AB segment. The anticipated drop was marked as a red CD segment.
Thank you very much for your voting activity in my earlier post (please link https://www.ino.com/blog/2018/07/sp-500-not-rocket/) as I am grateful for your support of my outlook as 70% of the readers voted for the upcoming drop as it is shown in the snapshot below. That is why I feel comfortable putting the labels of the CD segment down to express my outlook.
Snapshot of the earlier vote
(please link https://www.ino.com/blog/2018/07/sp-500-not-rocket/)
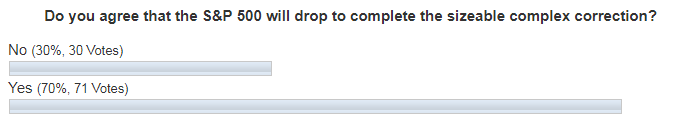
Image courtesy of INO.com
I intentionally kept a few old annotations as they still work. One of them is the blue uptrend, which is yet to be broken as it shows the crucial boundaries, especially on the downside as upside already kept the index from further growth. The breakdown of it in the area of $2765-2785 is needed to confirm the end of the counter-trend correction.
Above it, there is minor support (purple), which contours the last move up within the larger blue uptrend. It will give us the first bearish alert once breached below $2800-2820 area.
Our ever assisting RSI indicator now has the visible Bearish Divergence on its sub-chart as we can see the lowering peaks versus the higher tops on the price chart. It is another warning signal for the market players as the RSI is already playing out that divergence as it approaches the crucial 50 level. I think the dip below that level would coincide with the breach of the minor purple support on the main chart.
Rarely the market moves as the crow flies instead we can often see the zigzags within the trends. Therefore, I built the red zigzag down to reflect the possible move down in the index. As this large, complex correction unfolds within a broad $2533-2873 range, then it is quite easy to identify the target for the possible upcoming drop. The bears could attempt to tag the downside of the range at the $2533 once again as it doesn’t look impossible as during the first collapse.
Only above the $2873 we will get the first signal of possible invalidation for this scenario as corrections are tricky and whales could wash out the crowd to feed it at the peaking prices and then just slaughter it on the drop. Let us live and see.
I put the “Never” option for those who disagree with this plan.
Intelligent trades!
Aibek Burabayev
INO.com Contributor
Disclosure: This contributor has no positions in any stocks mentioned in this article. This article is the opinion of the contributor themselves. The above is a matter of opinion provided for general information purposes only and is not intended as investment advice. This contributor is not receiving compensation (other than from INO.com) for their opinion.
Good Info..