S&P 500: Drag & Drop?

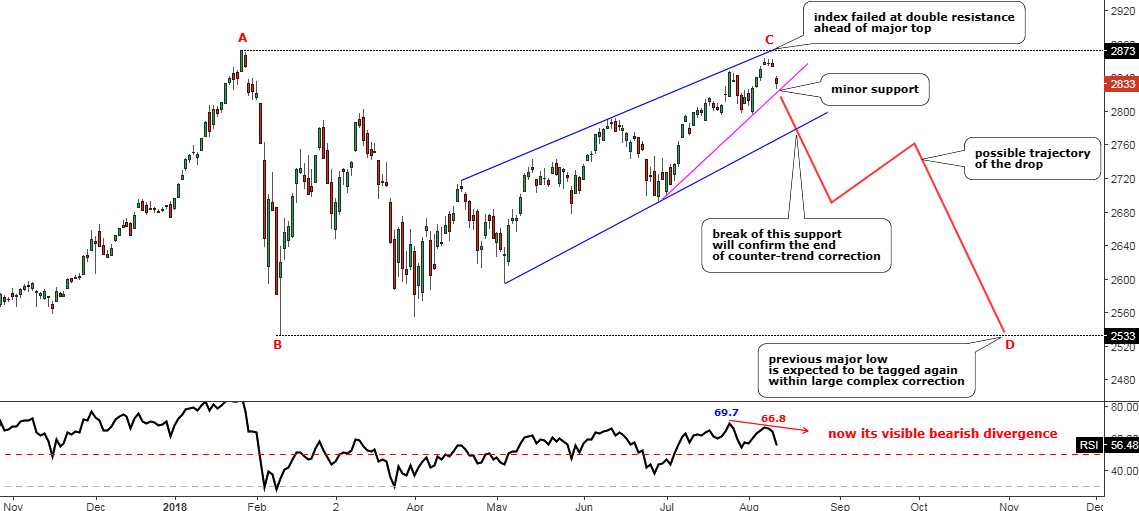
Last August I was thinking of the S&P 500 index and wondered if its uptrend had been exhausted on its way to the upside. The price was at the $2833 level, and it failed to break the earlier top of $2873. The RSI showed the Bearish divergence and the index started to drift lower. I thought it was a complex correction and another drop to hit the lower bound of the $2533-$2873 range was considered to be imminent. The majority of you supported this idea.

Let’s check the updated chart below to see what happened next.

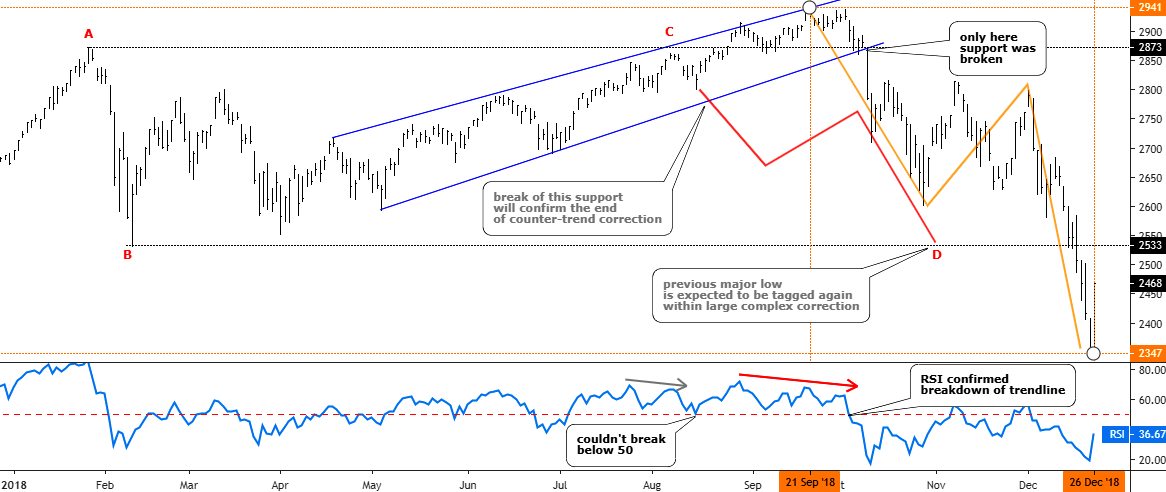
Updated S&P Daily chart tailored in August 2018.
LLLL
Chart courtesy of tradingview.com

As we can see from the chart above the idea itself was good as the price not only retested but just smashed the so-called “bottom” of the range. The actual CD segment, which initially was thought to be equal to AB segment, had reached the ratio of 1.75 exceeding the next most common after 1:1 ratio of 1.618 (Fibonacci ratio) amid the panic sell-off. The trigger, which was set on the downside of the blue uptrend, was right as the index didn’t look back until the very bottom after it fell out of that blue uptrend. That move was accurately confirmed with a breakdown of the 50 level on the RSI sub-chart. The predicted zigzag structure of the drop also appeared to be correct as it is natural market behavior when one market stage changes the other. And talking about where we were right, I also would like to show you the ballot results on the timing of the bottom of the drop. Continue reading "S&P 500: Drag & Drop?"

How Low Could The S&P 500 Go?

Our target for the first half of 2019 is and has been the 2100 to 2200 area for the S&P 500. A friend asked…

I’ve been meaning to ask (and possibly) know the answer, 2100-2200 for H1 2019 is your ultimate bear market target or opening act?

Opening act. It could be the ultimate target because there is a lot of support at that area and a good solid bear phase could put the Fed on ice and impose some changes to Donald Trump’s bull in a China shop policy style.

So, for now, I see no reason to make dire proclamations beyond that key support level, as so much will depend on incoming information in 2019. At this point, even 2100-2200 is not technically in the bag because the US stock market clung to last-ditch daily chart support, as per the marginally favored short-term NFTRH view. So all of we bear callers need to remember that as ugly as the charts are, support is not broken until it is… broken.

I was going to cover this in NFTRH 530‘s Opening Notes segment, but why not make it a public post and save NFTRH’s virtual ink for more immediate issues going on with the markets? Before we dial out to a couple of simple SPX charts showing the prospective downside targets, let's review the situation with a less than simple chart. Continue reading "How Low Could The S&P 500 Go?"

S&P 500: Exhausted?

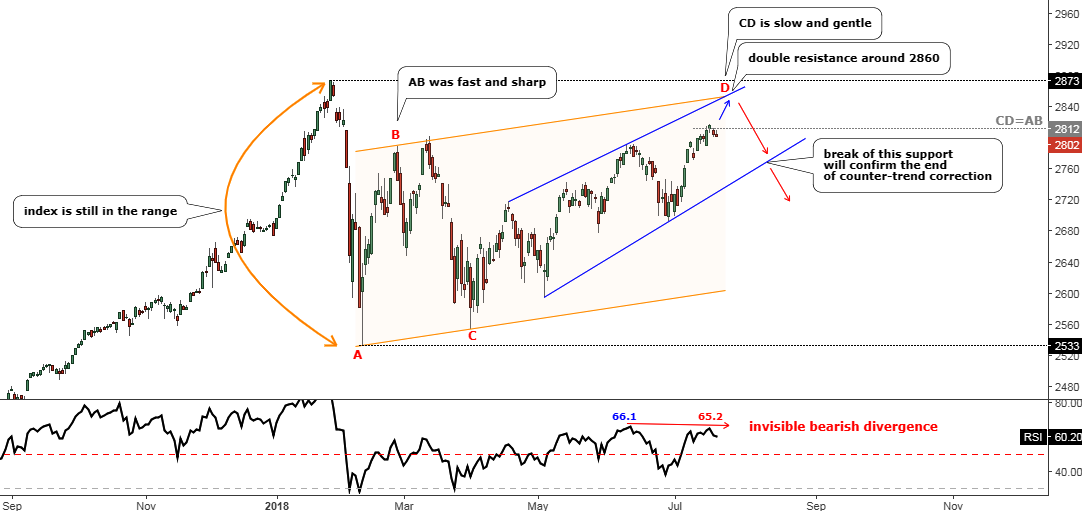
Last month I shared with you my concern about the possible reversal of the index in spite of the solid gain booked earlier. The chart of the S&P 500 spoke for itself, showing a weakness in the structure of the move up. The angle of the uptrend was too gentle to sustain. And the finishing punch came from the RSI indicator, which had an invisible Bearish Divergence on its chart.

We never know what the future will bring us, although this time the geometry of the double resistance worked just perfect as I assumed another spike to that area of $2860 before a reversal in my earlier post. Bingo! The index peaked right in that area at the $2863 and then collapsed. This is further proof of the magic power of the trends.

Chart: S&P 500 Daily: Watch Support After The Failure At The Resistance

SP 500 Exhausted
Chart courtesy of tradingview.com

This is an updated chart above, which reflects the market changes and shows the outlook of the possible upcoming behavior of the S&P 500. Continue reading "S&P 500: Exhausted?"

S&P 500: Not A Rocket!

Back in May, I posted the alert about the upcoming rally of the index in case of the breakup of the triangular consolidation. Indeed, the S&P 500 already booked more than a 100 points gain from that day ($2679) but what I see in the chart now is not inspiring me these days.

Below is the new daily chart where I made the annotations to express my concerns.

S&P 500 Daily Chart: The Index Loses Steam Within A Possible Large Complex Correction

S&P 500 Daily Chart
Chart courtesy of tradingview.com

First of all, let me tell you why I gave the title “Not A Rocket” to this post. Usually, a good rally has a sharp angle of the trend, and anyone could easily identify it with the naked eye. This is what I was looking forward to giving the title for the earlier post using the proverbial phrase “Fasten Your Seatbelts.” Continue reading "S&P 500: Not A Rocket!"

S&P 500 Finishes Consolidation, Fasten Your Seat Belts!

Aibek Burabayev - INO.com Contributor - Metals - S&P 500 Finishes Consolidation


This past February, I drew your attention to the S&P 500 index, which started a consolidation, addressing two critical questions about the future of the index. The most important answer said that we are still in the long-term uptrend and we should keep patience to see the end of the consolidation.

Later in April, I shared an update with you with a detailed plan for two possible options of the ongoing consolidation. The first one implied the development of the familiar Triangular pattern, which in its turn had two possible paths of price action. And the second path with a zigzag inside of the Triangle was drawn with an amazingly accurate prediction as the index just repeated its trajectory.

Another possible option was described within the forecasted Bull Flag pattern. This model didn’t develop as planned as the price couldn’t break below the previous low at $2532; although we were very close to hitting it as the index’s drop reversed just $31 ahead of it at the $2553 level. This plan is very close to invalidation once the price overcomes the earlier top at $2718.

Below I prepared an update of the most valid option for you. Continue reading "S&P 500 Finishes Consolidation, Fasten Your Seat Belts!"