
Our research team has become increasingly concerned that the US Fed support for the markets has pushed price levels well above true valuation levels and that a risk of a downside price move is still rather high. Recently, we published a research article highlighting our Adaptive Dynamic Learning (ADL) predictive modeling system results showing the US stock market was 12% to 15% overvalued based on our ADL results. Today, Tuesday, May 26, the markets opened much higher, which extends that true valuation gap.
We understand that everyone expects the markets to go back to where they were before the COVID-19 virus event happened – and that is likely going to happen over time. Our research team believes the disruption of the global economy over the past 70+ days will result in a very difficult Q2: 2020 and some very big downside numbers. Globally, we believe the disruption to the consumer and services sector has been strong enough to really disrupt forward expectations and earnings capabilities. We’ve been warning our friends and followers to be very cautious of this upside price trend as the Fed is driving prices higher while the foundations of the global economy (consumers, services, goods, and retail) continue to crumble away.
Our biggest concern is a sharp downside rotation related to overvalued markets and sudden news or a new economic event that disrupts forward expectations. Q2 data will likely be a big concern for many, yet we believe something else could act as a catalyst for a reversion event. Possibly global political news? Possibly some type of extended collateral damage related to the global economy? Possibly something related to earnings expectations going forward through the rest of 2020 and beyond? We believe things are not “back to normal” at this stage of the recovery, and we believe the markets are moderately over-extended at this time.
ES ADL Predictive Modeling Weekly Chart
This Weekly ES (S&P500 E-Mini Futures) chart shows our ADL predictive modeling system’s expected future price level targets, which suggest the current market price level is 12% to 15% (or more) above these target levels. Remember, the ADL system uses a custom price mapping technology that is designed to identify “price/technical DNA markers” within historical data – then attempt to map out future price level activity and track the highest probable outcomes of these price DNA markers. The objective of this research tool is to show us what type of price activity is highly probable based on historical data and predictive modeling research. This unique trigger on the ES chart consisted of 5 historical DNA markers and suggests a future probability of 70% to 87% regarding future price target levels.
One aspect of our research, while using the ADL predictive modeling system and our other tools it the concept of “price anomalies.” These are rallies or sell-offs that extend beyond support or resistance levels and when price levels trend away from ADL predicted target levels. We created the term “price anomaly” and explain it to our members as “some external force is pushing the price above or below the projected target level. Once this force abates or diminishes, the price will likely move, very quickly, to levels near the ADL predicted target levels.”.
Currently, the US Fed is engaging in a moderate support effort for the US stock market, and it is reportedly buying $5+ billion a day in bonds and assets. Although it may seem impossible to fight the fed, we believe the markets (like nature) are almost impossible to fool and control. We believe that price will react to market conditions and that future price rotation (both up and down) will continue to be more volatile than many traders expect.
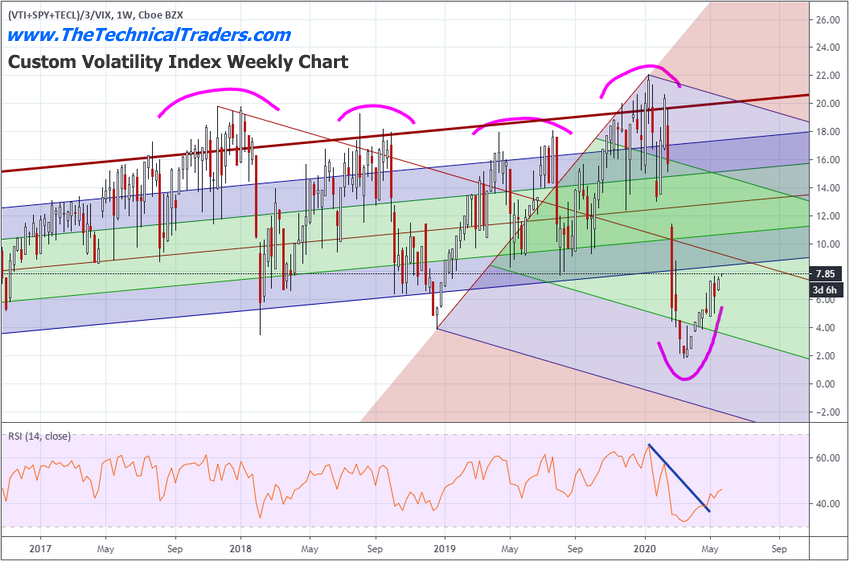
Custom Volatility Index Weekly Chart
This Custom Volatility Index chart highlights the extremely low levels recently established by the COVID-19 market sell-off. These new low levels have created the deepest sell-off levels on this chart in 20+ years. It has also established a new, highly volatile, downward price channel that our researchers are following to help us determine where resistance will likely be found.
We believe a new downward price rotation is setting up for some time in the near future that will establish a tighter price channel and assist us in determining when and where the ultimate price bottom will setup and complete. With the VIX levels still near 27~29, we are certain that volatility has not decreased even though price levels have attempted a solid recovery over the past 8+ weeks.
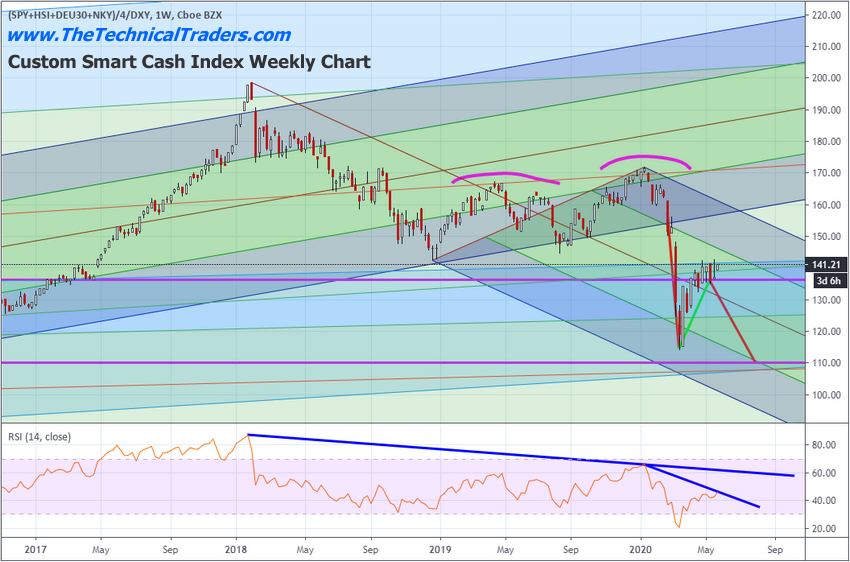
Custom Smart Cash Index Weekly Chart
This Weekly Custom Smart Cash Index chart highlights the true function of price within the US stock market and highlights the overall weakness still at play within the current markets. Even though the NQ has rallied to near all-time highs, the Smart Cash Index is showing the broader market is still rather weak and that recent price activity has stalled into a sideways/flag formation. The broader market buying that took place near the end of March 2020 and throughout April 2020 has stalled. The Fed became the market for the past 8+ weeks, and as the Fed diminishes its activity, it will be up to the markets to manage trends and future expectations going forward.
Our researchers are concerned that a sudden breakdown in the Smart Cash index may prompt a bigger downside price move in the global markets. Our research team has continued to issue warnings to our members to run protective stops on any open long positions, to properly size trades to avoid excessive risks and to properly hedge your trading using precious metals, miners, and Bonds. In short, these risks are very real. You can still make a profit trading the long side of the markets, but we suggest that you take all the necessary steps to protect your trades.
Custom US Stock Market Index Weekly Chart
This last Weekly Custom US Stock Market chart highlights two very important levels related to our Fibonacci Price Amplitude Arcs. These arcs represent critical Fibonacci support and resistance levels that arc across time and price levels. It is important to understand these levels will present very real inflections in price – at least we expect them to create price inflections.
Currently, there is the YELLOW Fibonacci price arc that is acting as resistance near the current highs and the MAGENTA Fibonacci price arc that is much longer-term. This longer-term Fibonacci price arc may be stronger than the current shorter-term arc. Our researchers believe the current Fibonacci arc levels on this chart will prompt price to “flag out” in a sideways price channel before potentially breaking downward.
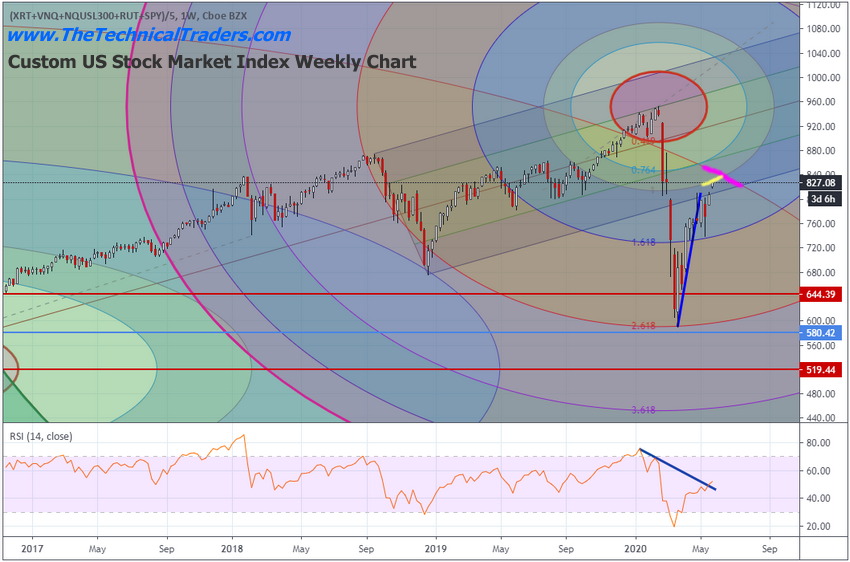
As we continue to watch for weakness across these charts and trends, we urge skilled technical traders to be prepared for a sharp spike in volatility over the next 4+ weeks. It appears we are only 2 to 4+ weeks away from reaching these major price inflection points. Currently, we believe a downside move is the most probable outcome based on our ADL predictive modeling system results, as well as the technical patterns seen on these charts.
Overall, we believe the increased volatility levels in the US stock market will present some incredible trading opportunities for technical traders. Big swings, near-perfect technical patterns and setups, quick profits, and broader sector rotations. This is the type of market where skilled technical traders can really enjoy a target-rich environment. We just have to be selective in how we determine when to enter trades and not to take excessive risks.
You don’t have to be smart to make money in the stock market, you just need to think differently. That means: we do not equate an “up” market with a “good” market and vi versa – all markets present opportunities to make money!
We believe you can always take what the market gives you and make CONSISTENT money.
Learn more by visiting The Technical Traders!
Chris Vermeulen
Technical Traders Ltd.
Disclosure: This article is the opinion of the contributor themselves. The above is a matter of opinion provided for general information purposes only and is not intended as investment advice. This contributor is not receiving compensation for their opinion.
if the Fed is the creditor to all this bond buying, then who's the debtor? because for every credit there is a debit.
and there's student loans, car loans, mortgages, insurance, taxes, and Selective Service
Excellent information. Thanks for the heads up.