
My team prepares Custom Valuations Index charts to understand how capital is being deployed in the global markets alongside US Dollar and Treasury Yields. The purpose of the Custom Index charts in this article is to provide better insight into and understanding of underlying capital movements in various market conditions. Recently, we discovered the Custom Index chart shares a keen alignment with Gold (and likely the general precious metals sector). Let’s explore our recent analysis to help readers understand what to expect next in precious metals.
Weekly Custom Valuations Index Chart
The first thing that caught my attention was the very clear decline in the weekly Custom Valuations Index recently, as can be seen in the chart below. The second peak on the Custom Valuations Index chart occurred on the week of August 3, 2020. Gold also peaked at this very same time. This alignment started an exploratory analysis of the Custom Valuations Index and the potential alignment with the precious metals sector.
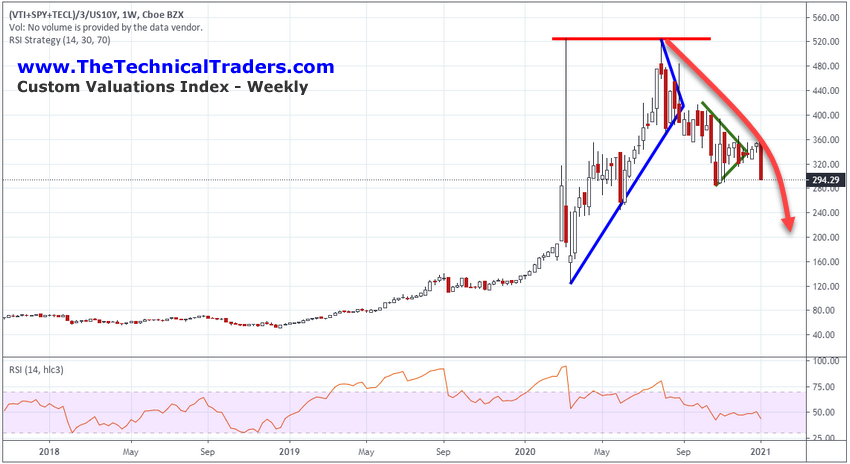
The peak in the Custom Valuations Index on March 20, 2020 (near the height of the COVID-19 market collapse) presented a very clear upside target which was confirmed with a second peak level in August 2020. The fact that the Custom Valuations Index reached that peak level again and that peak level also aligned with the peak price in Gold may just be a coincidence. As we continue to explore this unique alignment, we’ll explore more unique characteristics to see if there is a link that is more than mere chance.
There have been two very clear Pennant/Flag formations as you can see on the above weekly Custom Valuations Index chart. The first one is highlighted in BLUE and the second one is highlighted in GREEN. In both of these instances, the Custom Valuations Index broke lower and Gold followed this trend. Currently, the Custom Valuations Index has begun to breakdown into a new bearish trend. This suggests that Gold and Silver may also move lower as this Custom Index attempts to find a bottom.
Now, let’s do a more in-depth analysis of Gold and the Custom Valuations Index. In the following charts, we’ve attempted to highlight key price traits that took place in Gold over the past 9+ years and wanted to see if these key price points were reflected in the Custom Valuations Index chart. The purpose of this is to identify if our assumption that the Custom Valuations Index chart is aligned to Gold (in some way) shows any additional (past price) alignment to validate our thinking.
Weekly Gold Chart
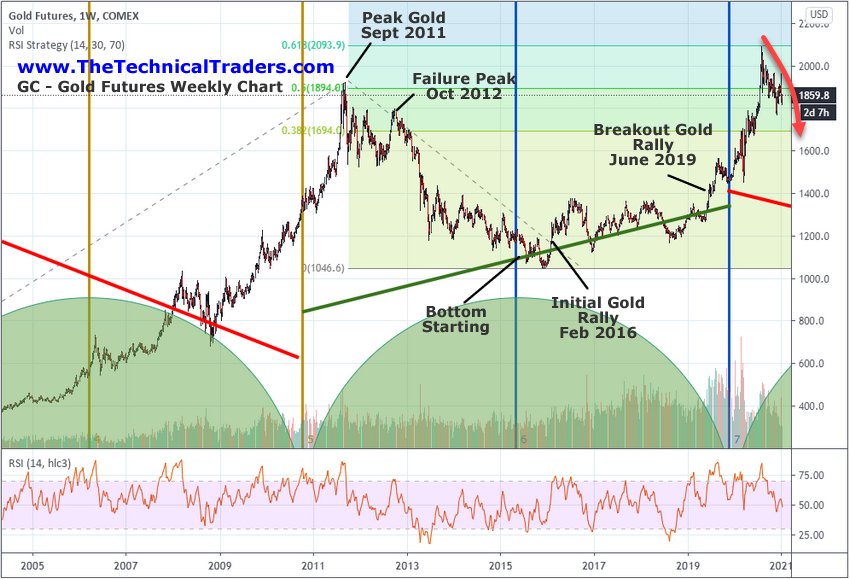
First, we’ll start with a Weekly Gold chart that highlights key price points, peaks, bottoms, and breakout/breakdown events. We want to see if the Custom Valuations Index chart also aligned with these key price moves/dates.
The following Gold Futures Weekly chart highlights the Appreciation/Depreciation cycles we’ve identified in earlier research as well. The GREEN ARCs near the bottom of the chart show you where each cycle starts and stops. The RED descending line represents a Depreciation Cycle and the GREEN Ascending line represents an Appreciation Cycle. We are focusing on the September 2011 peak price in Gold and the key price events after the “Failure Peak” that took place to set up the bottom in early 2015, the rally in early 2016, and the breakout rally in June 2019. Does the Custom Valuations Index chart show these same characteristics and dates?
Weekly Customs Valuation Chart And Gold Price History
This next chart is the Weekly Custom Valuations Index chart with the same highlighted price points/dates. The first thing we see from this chart is that the “Failure Peak” (October 2012) was a higher price peak on this Custom Index chart than the setup on the Gold chart at the same time. Thus, the Custom Valuations Chart represented the extended “excess phase” top in Gold as a continued upward trend. The downtrend after the October 2012 peak on this Custom Valuations Index chart does align with the big breakdown on the Gold chart (above).
These Stocks Are Ready to Break Out
Over 5K stocks are trading on the U.S. and Canadian exchanges. While you may hear about the same companies over and over again, some of the biggest trading opportunities can come from "no-name" stocks.
See which stocks (some you may never have heard of) made it onto today's 50 top stocks ranked by their technical trend.
Additionally, the early 2015 bottoming on the Custom Index chart represented a very early sign that Gold may be looking for a bottom as well. Gold did move lower throughout the next 11+ months, but so did the Custom Valuations Index price. It makes sense that the Custom Valuations Index may be representing underlying key market dynamics that could be applied to the Gold chart in some way.
The Initial Gold Rally in February 2016 was the first real clear trigger on both these charts that coincided with a breakout/rally trend in Gold. This rally attempt eventually stalled near the end of 2016 and began an extended “momentum base” setup. Notice how the Custom Valuations Index chart represented this momentum base as and extended sideways Pennant/Flag formation that ended near June 2019. Also, notice how the stalling in the Custom Valuations Index chart initiated many weeks before Gold actually peaked in 2016.
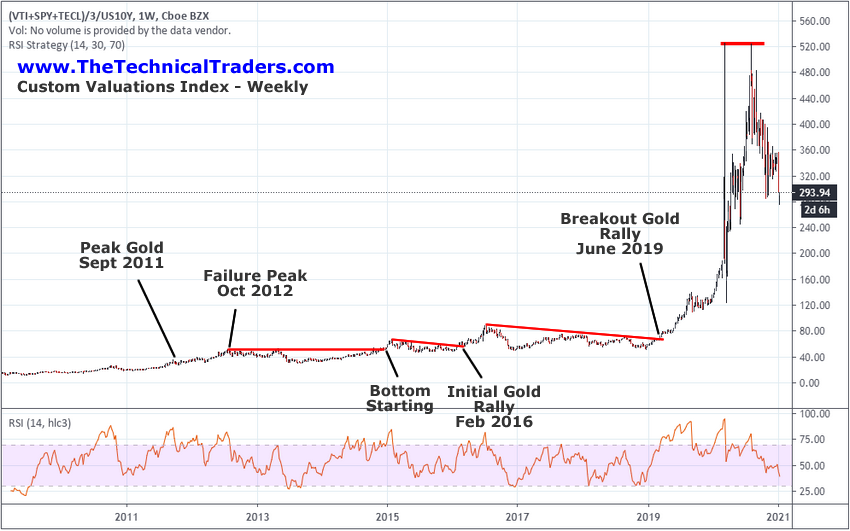
From the February 2019 Breakout, we can clearly see the impressive rally in the Custom Index chart aligned with a big rally in Gold. What is interesting is the DUAL PEAK in the Custom Index chart that first setup from the lows of the March 2020 COVID-19 bottom. Could it be that extreme price move somehow represented a key future target for Gold and for the Custom Index chart?
There is very little corresponding data to compare to – so we’ll have to continue to try to dig deeper for any confirmation of this unique setup. Yet, we can’t underestimate the DUAL PEAK setup on the Custom Index chart and the fact that the second peak, August 2020, also aligned perfectly with the current peak price in Gold. Since that August 2020 peak, both Gold and the Custom Index chart have continued to breakdown and trend lower. It makes sense that Gold will continue to move lower, in alignment with the Custom Index chart, attempting to find a new bottom/momentum base. We believe the 200 to 240 level on the Custom Valuations Index chart may be a suitable range for this new bottom.
One thing we can say with a moderate degree of certainty is that the Custom Valuations Index chart appears to lead the precious metals in many instances and it appears to perfectly align in other instances. Our research suggests the US and global markets have recently entered a Depreciation Cycle phase which may last many years. The Custom Valuations Index chart is suggesting that the US, global and precious metals sectors are weakening and attempting to find/set up a new momentum/base.
This would suggest that capital will move away from precious metals as well as major market sectors and attempt to find opportunities in undervalued or other hot sectors. Eventually, once the new momentum base/bottom is firmly established in Gold and the Custom Valuations Index chart, the US and Global major market sectors will likely resume a very strong upside price trend.
The key take-away from this research is that sector rotations related to precious metals, major global markets and potential early warning signs of strength or weakness may be attainable by focusing on how the Custom Valuations Index trends in comparison to Gold and the major indexes. Currently, the Custom Valuations Index is suggesting that precious metals will move lower and try to find a new bottom/base. This means other market sectors will perform better than precious metals for a period of time.
This is also an important reason to focus your attention on finding the best and hottest sectors for new trade opportunities. When broad components of the market enter bearish trends, like the Custom Valuations Index is suggesting for precious metals, it is best to have a proven system for identifying the best sector trends and trade opportunities. While one sector may stall, others are rallying. Long term success is found by focus your trading capital on the strongest opportunities while avoiding weaker trends.
Don’t miss the opportunities in the broad market sectors over the next 6+ months. 2021 and beyond are going to be incredible years for traders. Staying ahead of these sector trends is going to be key to developing continued success in these markets. As some sectors fail, others will begin to trend higher. Learn how BAN Trader Pro can help you spot and trade the best trade setups while mitigating risks at every turn. You owe it to yourself to see how simple it is to trade 30% to 40% of the time to generate incredible results.
Please take a minute to visit my website to learn about our BAN Trader Pro and our other services and courses that are all designed to give you that edge you need to be a successful trader.
Enjoy your weekend!
Chris Vermeulen
Technical Traders Ltd.
Disclosure: This article is the opinion of the contributor themselves. The above is a matter of opinion provided for general information purposes only and is not intended as investment advice. This contributor is not receiving compensation for their opinion.
When so much liquidity chasing how we can say this.
Is not it a sign of desperation.What has happened is the game played by republican president.Now is defeated at many fronts one can not go on speculating and making money.That is why yourself now deviating the previous path.
Stock market can not wait uncertainty and precious metal get boost in such times.