
Stock market price action is usually conducted in a series of up and down price phases – or waves/cycles. Typically, price will move higher or lower in phases- attempting to trend upward or downward over time. This type of price action is normal. Extended upward trends with very little downward price retracements happen sometimes – but not often. They usually happen in “excess phase” rallies or after some type of news event changes expectations for a symbol/sector.
Putting Concerns Into Perspective – Still Bullish
Since early November 2020, the US stock market has continued to rally in a mode that is similar to an excess phase rally – showing very little signs of moderate price rotation. While price volatility has continued to stay higher than normal, you can see from the SPY Daily chart below that it has rallied from $324.40 to $385.95 (over 18%) in just under 90 days. At some point in the future, a moderate price rotation/retracement will happen that may be in excess of 6% to 11% – as has happened in the past.
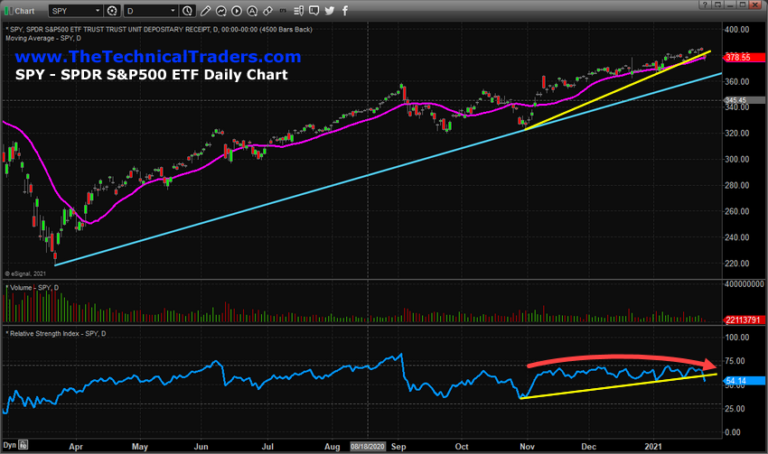
The purpose of this research post is to alert readers that the markets appear to have started a period of downside price rotation – which is normal. This SPY Daily chart, above, highlights the upward support channel originating from the March 21, 2020, COVID-19 lows (CYAN line) and also the upward support channel originating from the early November 2020 lows (YELLOW line).
It is important to understand that any downside price retracement which stays above the CYAN line level should be considered a normal range price rotation within a bullish trend. This suggests a -3% to -4% downside price trend from current levels would simply qualify as downward price rotation within a bullish trend – nothing more.
If price were to break below the CYAN upward trending support channel, then we would become more concerned that a deeper price downtrend is setting up which may target lows from Mid-November 2020 (-6.5%) or the late October 2020 lows (-13% to -14%) from current SPY price levels. Obviously, a deeper downside trend targeting the October 2020 lows would suggest the US stock markets are potentially entering a new phase of trending – possibly a sideways consolidation trend.
Tran Testing Support Near 12,180
The following Transportation Index daily chart shows a very clear picture of how this “rollover” in the markets has setup and where real support is likely to be found. The early January lows, near 12,180 are the most likely immediate support level on the TRAN Daily chart, below. If the US stock market attempts to find immediate support to sustain the current bullish rally trend, then this level in the TRAN will likely hold up well over the next few days/weeks. Otherwise, if the TRAN breaks below this level, then the next viable downside target become the November 2020 lows (or somewhere close to those levels).
Using Fibonacci Retracement Theory from the early November 2020 lows to recent highs, we achieve the following levels:
-
25% retracement: 12,628.92
38.2% retracement: 12,331.44
50% retracement: 12,065.47
61.8% retracement: 11,799.51
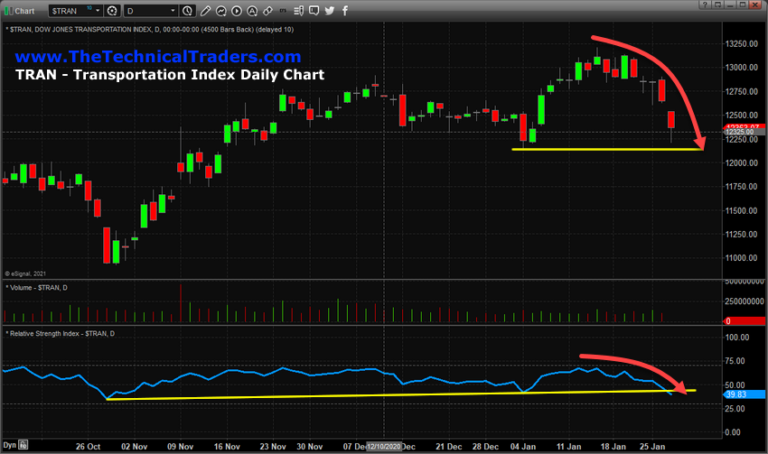
The 12,180 level we are suggesting will turn into critical support is just above the 50% Fibonacci Retracement level. Therefore, any further downside trending would be predicated by a breach of both the 12,180 level and the 12,065.47 level. If the price holds above either of these support levels confidently, we would consider further downside risks unlikely.
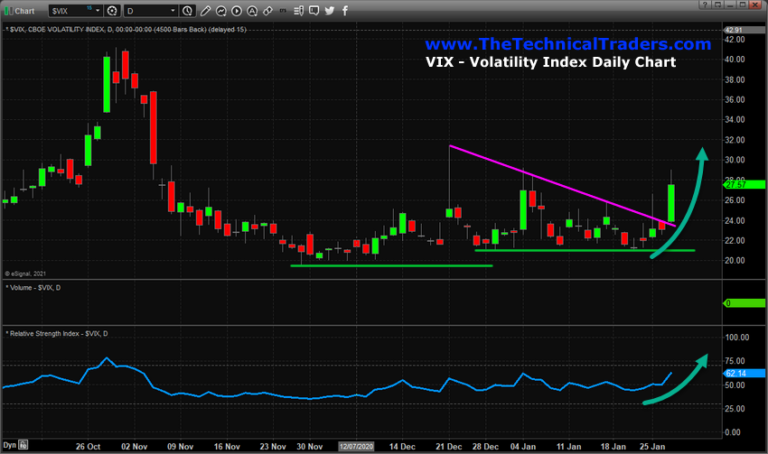
VIX Spike Higher Begins
The upward spike in the VIX recently is indicative of how volatile the markets have become after nearly 90 days of continued upward trending. Whenever the US stock market enters a decidedly bullish price trend for an extended period of time, the VIX naturally “normalizes” into a lower boundary and becomes hypersensitive to moderate price rotations. We’ve seen this happen many times in the past.
Because of the way the VIX is calculated, when these breakout moves happen while the market is conducting a relatively normal price rotation/correction, the VIX can sometimes spike above 35 or 45. To put this into perspective, the 2008-09 market crash prompted a VIX move to near 95. The COVID-19 market crash prompted a VIX move to near 85. Many other moderate market downtrends over the past 10+ years prompted VIX moves above 30~40. Three of the biggest “normal range” VIX moves happened in August 2011 (VIX level near 48), August 2015 (VIX level near 53.50), and February 2018 (VIX level near 50).
If another big market rotation were to take place in the near future, we believe early February would be the time/place for it to happen based on our predictive modeling system’s expectations (see this research article). We also believe this downside price swing will end fairly quickly and that a continued bullish price trend will resume in March or April 2021.
The potential for a broader market rotation and trend “reset” is aligning with our December 2020 predictions for 2021. Quite possibly, the downside price trending we are seeing now is the start of a 15 to 25+ day market rotation which will likely “reset” the bullish trending bias and allow for broader market trends to continue higher. We consider this an opportunity for traders to take advantage of this rotation in major markets and sectors.
2021 is going to be full of these types of trends and setups. Quite literally, hundreds of these setups and trades will be generated over the next 3 to 6 months using the Best Assets Now strategy. Are you ready for these big market rotations expected in 2021?
You don’t have to be smart to make money in the stock market, you just need to think differently. That means: we do not equate an “up” market with a “good” market and vi versa – all markets present opportunities to make money!
We believe you can always take what the market gives you, and make CONSISTENT money.
Learn more by visiting The Technical Traders!
Chris Vermeulen
Technical Traders Ltd.
Disclosure: This article is the opinion of the contributor themselves. The above is a matter of opinion provided for general information purposes only and is not intended as investment advice. This contributor is not receiving compensation for their opinion.
Great assessment and guidance!