
This week we have a stock market forecast for the week of 5/9/21 from our friend Bo Yoder of the Market Forecasting Academy. Be sure to leave a comment and let us know what you think!
The S&P 500 (SPY)
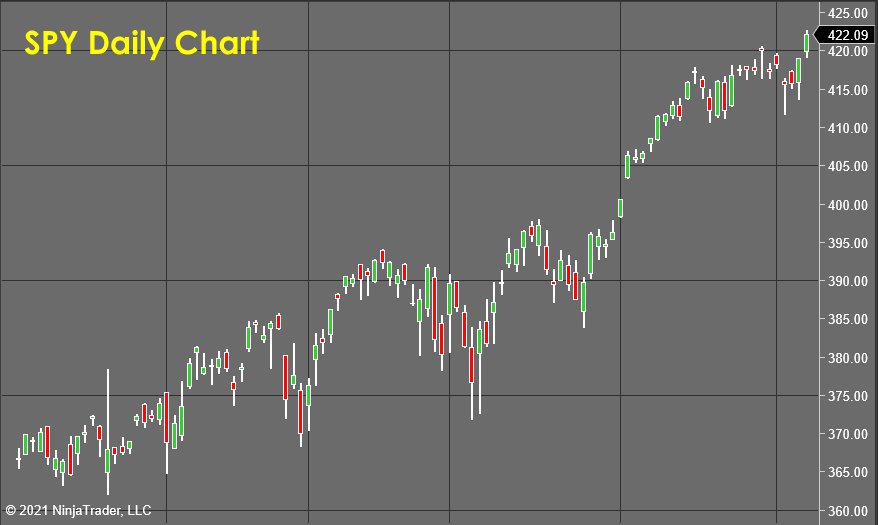
The S&P 500, (analyzed here using SPY) had created a topping process as I have been commenting on, and was on the 4th day of bearish activity when a new blast of buying took the market out to new highs.
This completes my forecast the other day when I said...
“I am expecting to see a correction form next week and then another push back up to retest the highs over the next couple of weeks.”
This push to new highs is showing as “unsponsored” in my suite of market forecasting tools. This indicates that the breakout is likely to be short-lived, and perhaps in a few weeks, we will look at this as the formation of a head for a new head and shoulders reversal pattern.
I am not looking for any new exposure this week as there is a lot open and so management of open positions and updating forecasts is the work of this week.
Autodesk (ADSK)
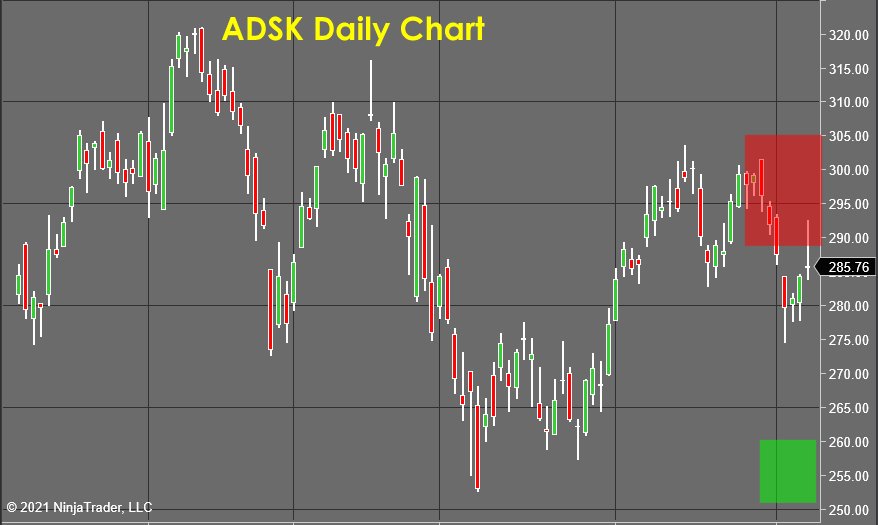
The stock of Autodesk (ADSK), sold off steadily and broke down below the recent range lows near $285 as forecast last week.
That bearish move positions this stock for a more significant fall in the weeks to come.
For now, the stock is oversold in the short term and a correction has begun to form. My forecast is that a lower high will form and that we will see continued downside movement as price pushes back down to explore the lows set earlier this year near $260 per share.
Like all my “actionable” forecasts, you will see red and green zones on the chart to designate entry, stop loss, and profit target zones. Therefore, this trade is attractive for short exposure anywhere within the red zone, with stop-loss orders set above that zones high.
My forecast would be for price to make its way back down to the green zone as the large liquidity pool near $260 per share is tested.
Electronic Arts (EA)
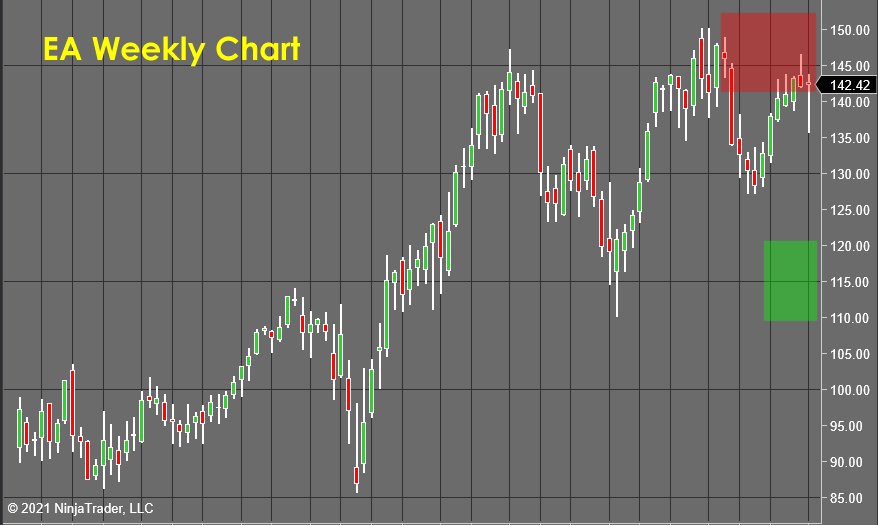
Electronic Arts (EA) reacted well to the weekly head and shoulders pattern I highlighted in last week’s forecast.
Price tanked early in the week to break down below the recent daily lows around $140, then zipped back higher as a correction formed.
Get Our Stock of the Week
Uncover the most undervalued and unappreciated stocks with our free, weekly newsletter. You'll get a new stock analysis every Tuesday!
This new position opportunity is considered attractive as a short anyplace within the red zone, with stop losses set above that area.
My forecast would be for the price to drop down to test the area indicated in green near the $120 per share area.
Coca-Cola (KO)
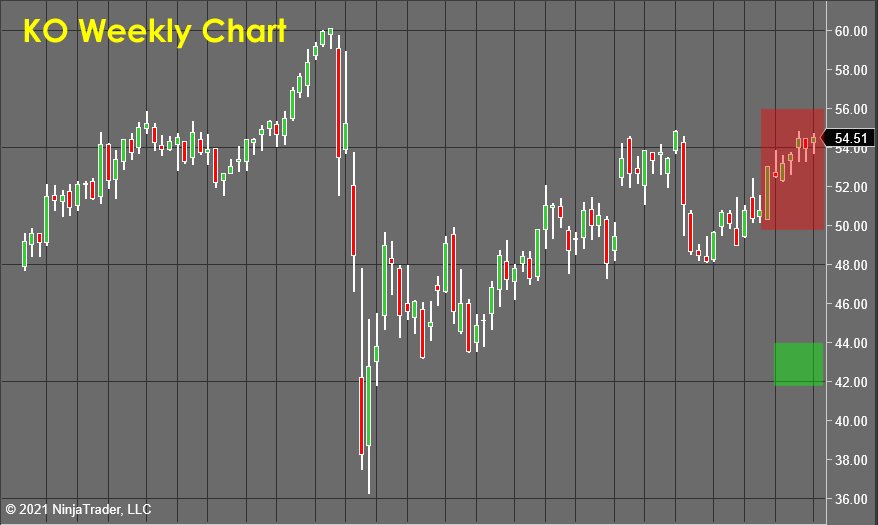
Coca-Cola (KO) continues to frustrate as it hovers and refuses to either break up above the high of the red zone, thus triggering stop losses, or finally turn lower and begin producing profits.
The odds for this trade’s success have plummeted this week, and this puts me into an interesting strategic position.
I always think about the math of trading in terms of $1,000 risk “units”. If I scratch the trade for nonperformance, it would book a loss of about $800 for every $1,000 of risk put into this position.
That’s not saving much, and while the odds for a profitable outcome are diminishing…KO is still bearishly biased and could pull it out.
So the math is this: Do I save a little money and book the loss, or do I let it work itself out?
In other words, am I more advantaged taking a certain $800 loss or do I leave it be and essentially risk an additional $200 for a small probability of making $1,000-$1,500?
The breakeven odds is for this question is about 17%...
Here is how that works out: If I risk $200 to make $1,000 and I make $1,000 17 times for a gross profit of $17,000 then lose $200 83 times for a gross loss of $16,600 I would produce a theoretical gain of $400.
So, therefore, as long as I have confidence that the odds for success of this trade are better than 17% I should stay in! (This is a lot like calculating “pot odds” in a poker game to determine whether the advantaged play is to bet or fold..)
Gold (GLD)
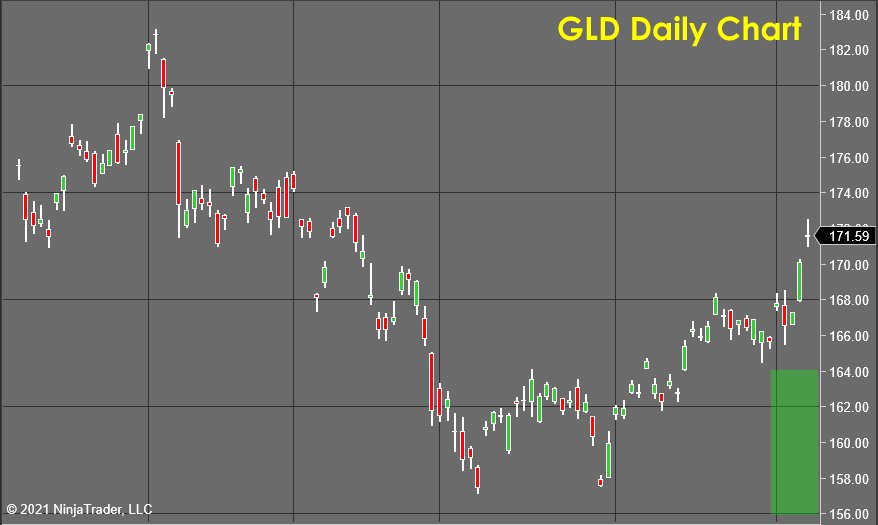
After Gold, (analyzed here using GLD) finished working out its textbook “breakout/retest” pattern, it chopped sideways for a few days, then launched higher like a rocket!
This price behavior confirmed the recent lows as a significant event and support created by last week’s correction is the new “floor as this very positive price action builds up the bull’s confidence and energy.
I am excited to hold the wiggles and let this position work itself out over the next few months!
Regeneron Pharmaceuticals (REGN)
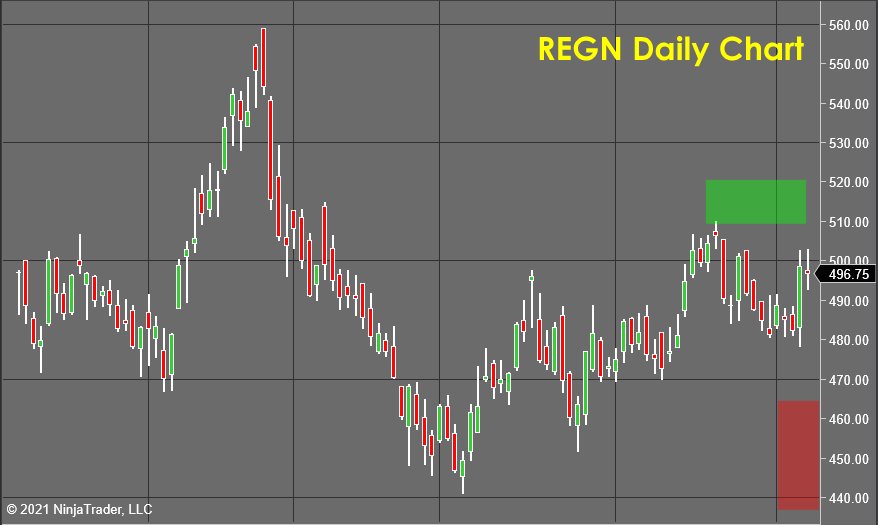
Regeneron Pharmaceuticals (REGN) rallied well but fell just short of the $510 I had for this week. This trade is taking its time and if it fails to break out this week it will likely correct back down to “wash out” the $480 lows.
Having already locked in gains, this trade is in a “no-lose” position, so my inclination is to let it go and force it to stop itself out... However, I have such a nice round of positions I’m managing right now so I believe that the buying power would be better deployed someplace else.
I’ll consider this trade closed out for a tactical exit by the end of Monday’s session...
The Eurodollar vs The US Dollar
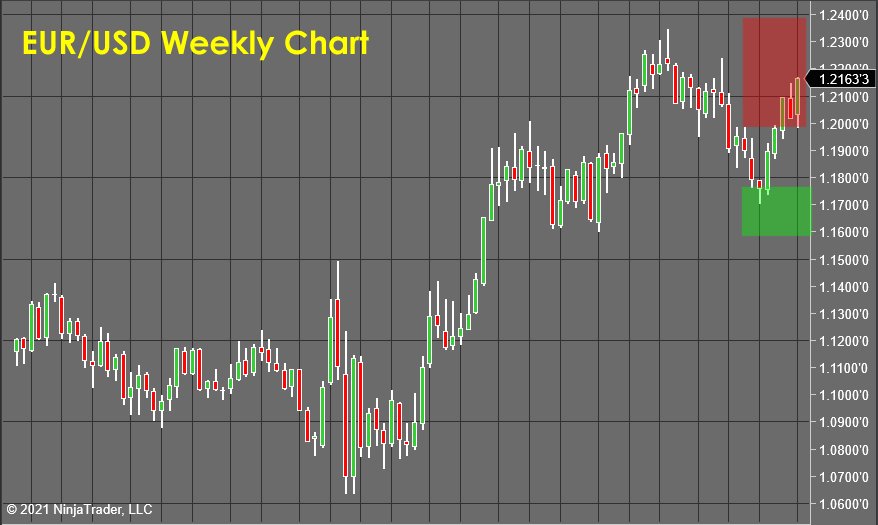
The EUR/USD currency pair formed a textbook head and shoulders reversal pattern last week. Price fell below that weekly bars lows to trigger a traditional entry, then squeezed hard back up to new highs.
The proprietary tools I use for measuring supply/demand so that I can accurately forecast prices show that this bullish move is not well sponsored. This implies that the rally will quickly fail and prices will then go back into the bearish side.
Next week’s action will tell a lot. If we see a strong rejection of this squeeze move next week, it would confirm the measurements I am seeing today and I would be confident that the bearish forces will regain their dominance.
In the meantime, this week’s squeeze offers a nice chance for some short exposure with a multi-month time horizon for anybody who missed the entry last week. This short is considered attractive anywhere within the red zone and should produce at minimum a retest of the lows near 1.1700.
To Learn How To Accurately and Consistently Forecast Market Prices Just Like Me, Using Market Vulnerability Analysis™, visit Market Forecasting Academy for the Free 5 Day Market Forecasting Primer.
Check back to see my next post!
Bo Yoder
Market Forecasting Academy
About Bo Yoder:
Beginning his full-time trading career in 1997, Bo is a professional trader, partner at Market Forecasting Academy, developer of The Myalolipsis Technique, two-time author, and consultant to the financial industry on matters of market analysis and edge optimization.
Bo has been a featured speaker internationally for decades and has developed a reputation for trading live in front of an audience as a real-time example of what it is like to trade for a living.
In addition to his two books for McGraw-Hill, Mastering Futures Trading and Optimize Your Trading Edge (translated into German and Japanese), Bo has written articles published in top publications such as TheStreet.com, Technical Analysis of Stocks & Commodities, Trader’s, Active Trader Magazine and Forbes to name a few.
Bo currently spends his time with his wife and son in the great state of Maine, where he trades, researches behavioral economics & neuropsychology, and is an enthusiastic sailboat racer.
He has an MBA from The Boston University School of Management.
Disclosure: This article is the opinion of the contributor themselves. The above is a matter of opinion provided for general information purposes only and is not intended as investment advice. This contributor is not receiving compensation for their opinion.
the markets are going higher theirs a 2 1/2 trillion dollars in the economy.
Just make sure you don't get stuck on the fundamentals or longer term viewpoint and skip or miss all the cyclical profit opportunities that show up in the meantime! It's very normal for an active trader to short a very strong stock and make great money as it reverts to the mean and pulls back to support!
The analysis on the SPY was excellent. Thank for that insight!. Think the Coke analysis was suspect considering the fundamentals of the companies board and management alienating half the population of the US by wading into politics. It'll take a lot of cute polar bear commercials to overcome the appearance of rabid jackal wokeness that they presented. Looks like dead money to me or at least a put play.
KO was a short forecast Rob...Bummer it got whipsawed. The political mess they caused was a factor in the measurements I took which gave me the bearish forecast. Glad you got some value off the SPY forecast, now that the base has broken, I am feeling pretty excited for next weeks forecasting!