
This week we have a stock market forecast for the week of 6/20/21 from our friend Bo Yoder of the Market Forecasting Academy. Be sure to leave a comment and let us know what you think!
The S&P 500 (SPY)
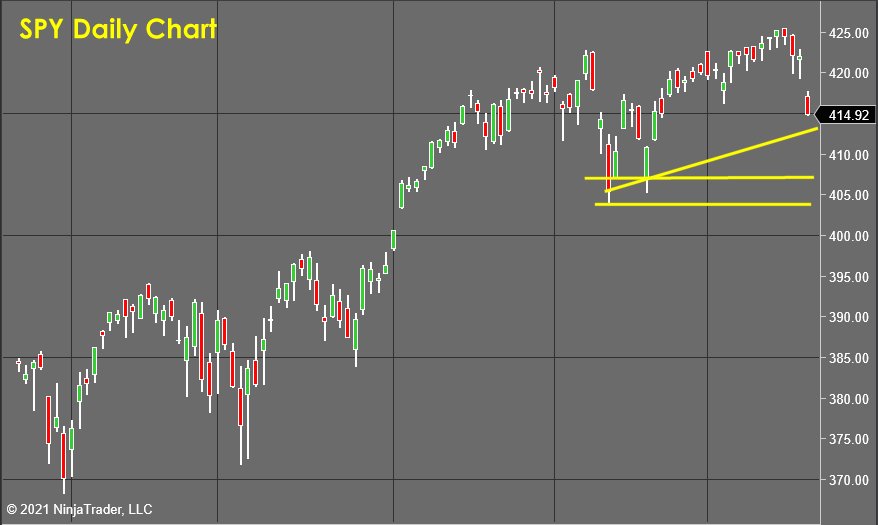
Although it wasn't precise enough to base a new position on, the historical tendency for a "dead and drifting market" to produce a big increase in volatility came true this time yet again.
As the market expands to the downside, there are two test points that I will be watching with great interest. The first is the trendline support which is relatively minor just above the $412 per share area. The second will be the area of support back near the recent lows. As these areas are tested, I will be taking measurements of the supply and demand forces at that time and will be in a better position to make an accurate forecast.
The forecasting tools that I use give me incredible amounts of clear and precise information about the supply and demand forces that are impacting the market right now. By taking measurements at specific intervals, I can forecast where those supply slash demand imbalances are likely to resolve. It's kind of like the process meteorologists use in order to predict the track of a hurricane. They look at the radar to see where the hurricane is and then look at how that picture changes over time in order to interpolate speed, velocity, and likely areas of landfall.
Another way to think about this is to imagine yourself deep underground in a pitch dark cave. You have absolutely no idea whether you're safe or on the edge of a cliff because you can't see a thing In the dark. If you turn on a flashlight, you instantly get clarity about your immediate surroundings. Because you can see everything within 10 or 15 feet very clearly, you can pick your way now throughout the cave system without fear or uncertainty, because you know that if there are any dangers or obstructions you will see them once you get within 10 or 15 feet of them and be able to make adjustments in order to keep yourself safe. That's how market forecasting as we teach at Market Forecasting Academy works, and why I am always looking for those pivotal places where I can get a measurement that tells me the odds are high for a directional move.
CSX Corp (CSX)
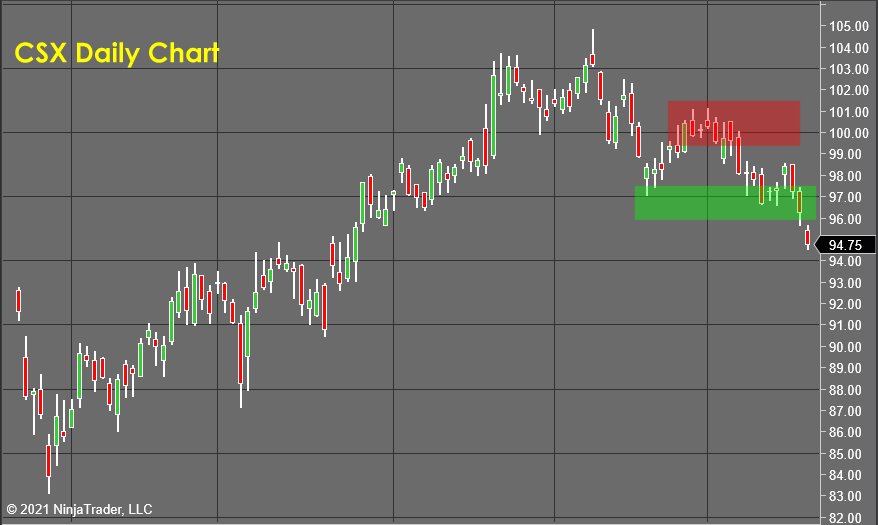
Last week, I wrote that the odds for CSX had shifted to what amounted to a 50/50 chance that we would go lower. As luck would have it, the coin flip ended up on "tails" and the stock sold off to make profit taking even sweeter for anybody who had been trailing stops instead of exiting on Monday. This trade is considered closed out for a nice gain.
Fluor Corporation (FLR)
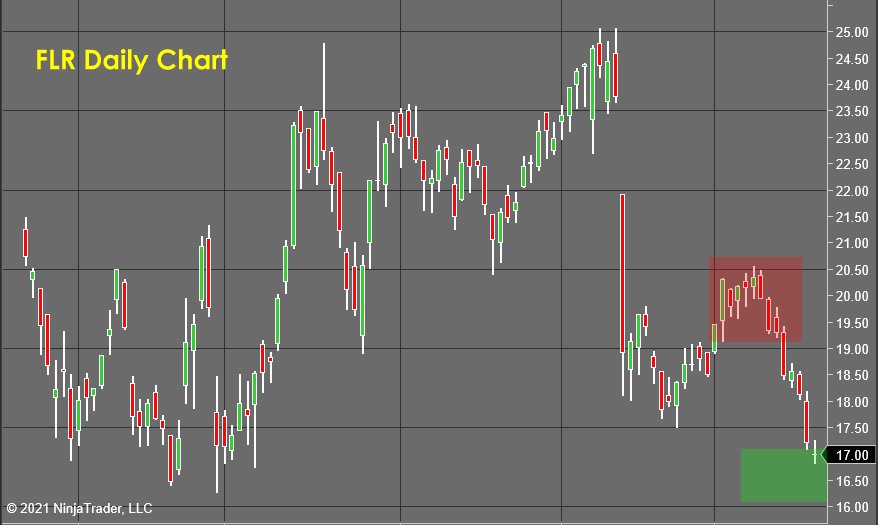
Fluor Corporation (FLR) pushed down to test its green zone in the very first week! I was hoping that the bearish pressures would increase dramatically as this test occurred, but unfortunately, that is not the case. An ambiguous bearish sentiment reading right now means that the odds have dropped for continued bearish movement.
It's time to take profits on this position and get ready to deploy capital in another venue. The failure of the bears to take charge doesn't hurt my ego one bit. I have to say, I wish all my "failures" would pay off this well... this quickly!
How I Generated a 738% ROI Using This Secret Strategy
I used a version of this exact strategy to win the 2019 U.S. Investing Championship and have been teaching it to my students for a decade.
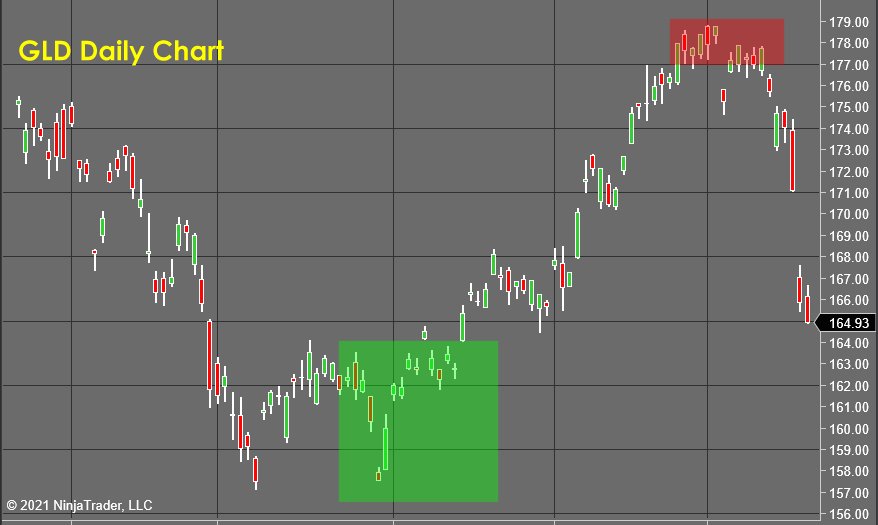
Gold (GLD)
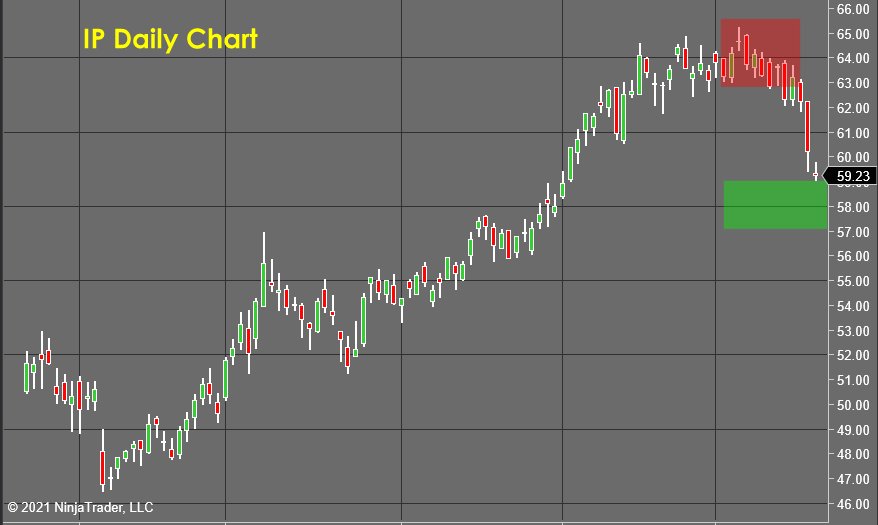
International Paper (IP) offered some quick and easy profits this week and closed out Friday's session just above the take profits area (green zone). In my initial forecast, I said..."I wouldn't expect this to go much below the green zone near $58." So, I would suggest that profits be taken next week to close this one out for a nice gain.
International Paper (IP)
With all of the monetary expansion and inflation we are dealing with, I believe that Gold (analyzed here using GLD) will continue to be an important market for traders to watch throughout 2021. This correction has a LOT of bearish power associated with it, so that will need to find support and dissipate before another long position can be taken, I am optimistic that we will get an opportunity of quality in this market before too much longer.
While I enjoy the elegance of this profitable exit point, I can't take any credit personally for the consistency and profitability of these forecasts. I am just reading my tools' measurements, so that makes me the equivalent to a reader reading you a poem that somebody else wrote. Anybody who has been trained in this process would come up with the same set of forecasts.
That said... It's always so gratifying when you get in near the bottom and out near the top, and the analysis tools my partner at Market Forecasting Academy, Roger Khoury has created give me the power and precision I need to put up trades like this.
There has been a lot of "free money" shared as the result of these forecasts over the past 4 months. I do this as a public service and to show people that even looking at it only once a week, the markets are NOT random, and can be accurately forecast. I hope you all got paid on at least one of the profits taken this week, and look forward to your comments!
To Learn How To Accurately and Consistently Forecast Market Prices Just Like Me, Using Market Vulnerability Analysis™, visit Market Forecasting Academy for the Free 5 Day Market Forecasting Primer.
Check back to see my next post!
Bo Yoder
Market Forecasting Academy
About Bo Yoder:
Beginning his full-time trading career in 1997, Bo is a professional trader, partner at Market Forecasting Academy, developer of The Myalolipsis Technique, two-time author, and consultant to the financial industry on matters of market analysis and edge optimization.
Bo has been a featured speaker internationally for decades and has developed a reputation for trading live in front of an audience as a real-time example of what it is like to trade for a living.
In addition to his two books for McGraw-Hill, Mastering Futures Trading and Optimize Your Trading Edge (translated into German and Japanese), Bo has written articles published in top publications such as TheStreet.com, Technical Analysis of Stocks & Commodities, Trader’s, Active Trader Magazine and Forbes to name a few.
Bo currently spends his time with his wife and son in the great state of Maine, where he trades, researches behavioral economics & neuropsychology, and is an enthusiastic sailboat racer.
He has an MBA from The Boston University School of Management.
Disclosure: This article is the opinion of the contributor themselves. The above is a matter of opinion provided for general information purposes only and is not intended as investment advice. This contributor is not receiving compensation for their opinion.
Looking ahead, the GLD just made a substantial down gap, due to mixed messages from the FED about rates maybe being raised earlier than previously expected, and the possibility of inflation being less transitory than liberals (Janet Yellen among them) would like us to believe. This also came as jobless claims increased at a time when they should have decreased.
This gap was caused by a tsunami of policy decisions that are choking the US economy, almost as though deliberately impeding our recovery from the COVID-19 crisis. If left alone, for example allowing us to maintain our energy independence which would have avoided a 50% increase in cost of gasoline, and if we'd been allowed to re-open more states, we'd be sailing along much more profitably and efficiently than we are now.
For many reasons, this gap down in the GLD price is exactly the sort of gap that is most likely to be filled in the future with a gap upwards. And we should all look forward to that, possibly delayed until 2022 mid-term elections, which could result in undoing the policy decisions made this year that are strangling the economy.
That gap might even be filled after some fall elections determining the fate of some state governments, which could easily accelerate re-opening and the return of job opportunities that have been prevented by some democrat state governments.
I'm going to address your comments in my analysis of the gold market this week! 🙂
I have always enjoyed Mr. Bo Yoder's analysis being scientific and well documented.
But this time I was tempted to write a comment as the analysis has gone beyond the usual level into a poetic and fictional sphere which has made the article even more enjoyable.
thanks
John
Thanks for the feedback John!
It's funny, I try to keep my comments tight and focused, because I want this to be a quick and easy resource.
I'll start adding more "Color" and background about what I'm seeing and why I feel it's important (because of your comment).
-Bo
hi i like your work
when you talk about supply and demand do you use the red and blue volume
thanks
I'm using a proprietary tool that my partner Roger Khoury at Market Forecasting Academy developed.
It takes into account the 8 major factors that drive pricing....
The 8 Market Forces Are:
1. The fundamentals and traditional Graham-Dodd, Warren Buffett style forces...
2. Geopolitical forces (Including Central-bank and Macro-economic effects)...
3. Volatility phase shifts...
4. Market sentiment...
5. Liquidity Levels (Includes Volume as well as Order Flow & Trade Flow)...
6. Prime liquidity pools (Essentially hidden to the untrained eye), which HFT (High Frequency Trading) algorithms, Brokers and Market-Makers love to target (manipulating the market)...
7. Imbalances in Supply and Demand...
8. Technical analysis factors and its effects on the market (takes into account and replaces the most useful technical indicators that traders use), including Fibonacci, Elliott Wave and Gann
This gives me as an "operator" of the methodology a real time snapshot of supply and demand that allows me to observe rate of change and volatility cycles and this is what gives me the information I need about the ULTIMATE fundamental....Buyers and Sellers and the pressure they are bringing into the market.