First we show you the theory ...

Now see the theory put into practice.

When you learn how the markets really work you will automatically benefit from this pattern in the future.

Adam Hewison
President, INO.com
First we show you the theory ...
Now see the theory put into practice.
When you learn how the markets really work you will automatically benefit from this pattern in the future.
Adam Hewison
President, INO.com
By JEREMIAH MARQUEZ
AP Business Writer
(AP:HONG KONG) Asian stocks were mostly higher Monday, with Hong Kong and South Korea's benchmarks up more than 2 percent, amid reports the U.S. government might take a larger stake in troubled banking giant Citigroup to ease the financial crisis.
Worries that major Western banks, crippled by growing losses from bad assets, might have to be nationalized sent markets sharply lower last week.
But investors seemed relieved to have some clarity about the fate of Citigroup after the Wall Street Journal, citing people familiar with the situation, said late Sunday that Citigroup Inc. is negotiating with authorities to increase the U.S. government's stake in the teetering lender to as much as 40 percent.
Executives would prefer to keep the government's stake closer to 25 percent, according to the Journal, which reported Citigroup made the proposal to regulators.
So far, President Barack Obama's financial rescue plans have met a lukewarm reception. But analysts say such a move could help restore confidence by finally bring a measure of stability to the hard hit financial sector, further boosting the chances for an economic recovery.
"People are taking it as a positive sign," said Francis Lun, general manager of Fulbright Securities Ltd. "It shows the government will not allow a major bank to fail again. They've learned their lesson with Lehman Brothers that the ramifications are so great, sometimes no amount of money can rebuild confidence."
Hong Kong's Hang Seng rose 291.26, or 2.3 percent, to 12,990.43 and South Korea's Kospi was up 25.39, or 2.4 percent, at 1091.22.
In mainland China, the Shanghai benchmark added 0.4 percent. Markets in Taiwan and the Philippines also edged higher.
In Japan, the Nikkei 225 stock average lost 29.12 points, 0.4 percent, to 7,387.26 as the yen strengthened against the dollar, thought recouped some its losses. Australian shares also fell.
U.S. futures were higher on the Citigroup report, suggesting Wall Street would recover at the open. Dow futures rose 67 points, or 0.9 percent, to 7,419 and S&P500 futures were up 7.8 points, or 1 percent, at 777.30.
Last Friday, continuing financial and economic worries sent the Dow Industrials down 100.28 points, or 1.3 percent, to 7,365.67 On Thursday, the Dow broke through its Nov. 20 low of 7,552.29, and closed at its lowest level since Oct. 9, 2002.
The Standard & Poor's 500 index on Friday fell 8.89, or 1.14 percent, to 770.05.
Oil prices were steady in Asian trade, with light, sweet crude for April delivery up 35 cents at $40.38 barrel. The contract edged down 15 cents to settle at $40.03 Friday.
In currencies, the dollar fell to 92.85 yen from 93.32 yen, while the euro strengthened to $1.2913 from $1.2825.
NEW YORK (AP) — Wall Street ended another terrible week Friday, leaving major indexes down more than 6 percent as investors worried that the recession will persist for at least the rest of the year and that government intervention will do little to hasten a recovery.
Investors shaved 100 points off the Dow Jones industrial average just a day after the market's best-known indicator dropped to its lowest level since the depths of the last bear market, in 2002. Stocks of struggling financial companies were among the hardest hit.
The Standard & Poor's 500 index, the barometer most closely watched by market pros, came close to its lowest point in nearly 12 years.
"Right now, more than a crisis in mortgages or in housing, we have a crisis in confidence. That is biggest problem in trying to analyze the current market," said James Stack, president of market research firm InvesTech Research in Whitefish, Mont. "You cannot analyze psychology."
Wall Street has been sinking lower as investors come to terms with the fact that the optimism behind a late-2008 rally was clearly unfounded. Companies' forecasts for this year, on top of a dismal series of fourth-quarter earnings reports, pounded home the reality that no one can determine when the recession will end.
"It was a market that was built on that hope, and what we're seeing now is an unwinding of that," said Todd Salamone, director of trading and vice president of research at Schaeffer's Investment Research in Cincinnati, of the rally from late November to early January.
The disappointment seen this week arose from the market's growing recognition that the Obama administration's multibillion-dollar stimulus and bailout programs are unlikely to turn the economy around anytime soon.
"There were a lot of people that were banking on Washington to get us out of this. I don't know if there is anything Washington can do," Salamone said. He said the global economy is going through the tedious process of reducing borrowing and working through bad debt — something government help can't speed up.
With the week erasing whatever shreds of hope the market had, there is virtually no chance of a rally on Wall Street. What the market might see is a blip upward — but blips tend to evaporate quickly.
That's what happened Friday. Stocks erased some of their losses after White House press secretary Robert Gibbs doused fears that the government would nationalize crippled banks. Investors who worried about seeing their shares wiped out by a government takeover welcomed the news, but it didn't ease broader concerns about the economy.
The Dow Jones industrials briefly went into positive territory, but quickly turned down again.
Salamone said investors had been too hopeful in late 2008 and at the start of this year that the new administration would be able to swiftly disentangle the economy.
The Dow industrials fell 100.28 points, or 1.3 percent, to 7,365.67 after earlier falling more than 215 points. On Thursday, the Dow broke through its Nov. 20 low of 7,552.29, and closed at its lowest level since Oct. 9, 2002.
The Dow's 6.2 percent slide for the week was its worst performance since the week ended Oct. 10, when it lost 18.2 percent.
The Standard & Poor's 500 index on Friday fell 8.89, or 1.14 percent, to 770.05. The benchmark most watched by traders came within less than 2 points of its Nov. 20 close of 752.44, which was its lowest since April 1997. It remains above its Nov. 21 trading low of 741.02.
The Nasdaq composite index fell 1.59, or 0.11 percent, to 1,441.23.
For the week, the S&P fell 6.9 percent, while the Nasdaq lost 6.1 percent.
Declining issues outnumbered advancers by about 3 to 1 on the New York Stock Exchange, where consolidated volume came to a heavy 8.12 billion shares as options contracts expired. Volume on Thursday came to 5.64 billion shares.
The Russell 2000 index of smaller companies fell 5.75, or 1.4 percent, to 410.96.
Other world indicators also fell sharply. Britain's FTSE 100 declined 3.2 percent, Germany's DAX index tumbled 4.8 percent, and France's CAC-40 fell 4.3 percent.
Shares of financial bellwethers Citigroup Inc. and Bank of America Corp. fell on worries the government will have to take control of them. Citigroup tumbled 22 percent, while Bank of America fell 3.6 percent. The stocks were down as much as 36 percent during the session.
The fears about the banks are hurting shareholders of those companies and dragging down the rest of the market because the broader economy can't function properly when banks are unable to lend at more normal levels.
"Financing is the blood which runs through our nation's veins. It's what keeps us alive," said Lawrence Creatura, a portfolio manager at Federated Clover Investment Advisors.
He said the talk of nationalizing banks only underscores the troubles with the economy.
"Things are clearly not normal. It's not healthy. The patient was on life support, and now what we're talking about getting out the paddle with respect to nationalization," Creatura said.
As investors dropped out of stocks, safer investments like Treasury debt and gold rose. The price of the benchmark 10-year Treasury note rose sharply, sending its yield down to 2.79 percent from 2.86 percent. The yield on the three-month T-bill, considered one of the safest investments, fell to 0.26 percent from 0.30 percent late Thursday.
Gold broke above $1,000, closing at $1,002.20 an ounce on the New York Mercantile Exchange.
Investors are looking desperately at any safe havens simply because the stock market, which rises and falls on investors' expectations for the future, sees only trouble ahead.
"There's still a big fear factor syndrome," said Michael Strauss, chief economist and market strategist at Commonfund. "There is a focus on what is happening here and now instead of six months to nine months from now."
___
The Dow Jones industrial average closed the week down 484.74, or 6.2 percent, at 7,365.67. The Standard & Poor's 500 index fell 56.79, or 6.9 percent, to 770.05. The Nasdaq composite index fell 93.13, or 6.1 percent, closing at 1,441.23.
The Russell 2000 index, which tracks the performance of small company stocks, declined 37.40, or 8.3 percent, to 410.96.
The Dow Jones Wilshire 5000 Composite Index — a free-float weighted index that measures 5,000 U.S. based companies — ended at 7,802.27, down 583.47, or 6.96 percent, for the week. A year ago, the index was at 13,758.35.
This little trading tip can and will make a difference in your trading results in 2009.
Stops are enormously important part of a traders arsenal of trading tools. Some traders confirm that stops are the most important part of their trading armour.
So here are three ways to use stops to protect your capital and lock in profits from a trade. These three money management techniques can be used in stock, futures and forex trading.
The important rule is that you do use a real stop in the marketplace. A friend of mine joked with me that that he had never seen a "mental stop" filled electronically or in the pits.
If the market is good your stop will not be hit. If the market is bad or changing direction then you'll want to be out of it anyway. That is why stops are so crucial to trading success.
Here are the three most commonly used types of stops. Which one do you use?
 (1) Dollar stop.
(2) Percentage stop.
(3) Chart stop.
If you chose (1) you'd be correct, but, you would also be correct if you had chosen 2 or 3. All three are money management stops and are used to either lock in profits or protect capital.
1) A dollar stop, is when you set a predetermined dollar amount to a trade. Let's say you want to risk $500 on a grain trade or $750 on a stock trade. Once you get your fill back from your broker or electronically online you simply figure from your fill price where to put your stop.
Pros: Easy to implement and use.
Cons: Can place stops too close in a volatile market
--------------------------------------------------
2) Percentage stop, is a very simple way for you to place a stop on a position. Here's how it works. Let's say your trading account is 100,000 dollars and let's say you only want to risk 1% of your total portfolio on any one trade. You simply take a $1,000 risk which represents 1% of your over all portfolio. This can help enormously in avoiding taking BIG LOSSES. A 1% loss is easy to absorb. A 30% or 40% loss in a trade is an account killer, and should be avoided at all costs.
Pros: Easy to implement and use.
Cons: Can place stops too close.
--------------------------------------------------
3) Chart stop, a chart stop is where you place a stop that is either above or below a crucial chart level. The good thing about a chart stop is that this level is often used by other traders. That can both be a good thing and a bad thing, here's why. Using either one of our first two examples only you know where the stop is. With a chart stop, a great many traders/brokers know that is where the stops are. In an illiquid market this type of stop should not be used, as many times brokers gun for the stops. In a highly liquid and active market this is a good stop to use.
Pros: Very easy to implement and use.
Cons: Can't be used in thinly traded markets.
--------------------------------------------------
So there you have it. Now you have all three ways to manage your money and protect your profits in 2009.
Use stops…let them work for you.
 Adam Hewison
President, INO.com
Co-creator, MarketClub
Be Our Guest
We welcome syndication of our content in your blog or on your trading website. Please feel free to use our content with attribution - more details here to syndicate our content
Today I'd like to welcome back Mark McRae from SureFireTradingChallenge.com. I personally have known Mark for over three years, with Adam knowing Mark well over 5, and Adam and I both agree that Mark is truly an innovator and one of the hardest working traders we know. His latest project, SureFireTradingChallenge.com, kept him holed up with charts and traders from all around the world to find some of the best methods in the world for trading. Check it out here.
Now his blog post today is more applicable now then it ever has been...support and resistance! Let me let Mark teach you a bit more:
=================================================================
Where exactly are the support and resistance points?
Where exactly are the swing points on a chart?
This is a particularly important lesson!
Just about every system or method of trading at least takes note of where the key support and resistance levels are.
I have found a double use for my method of identifying these points - They are also Swing Points!
You may think you know where Support and Resistance is, but do you really?
How do you know where support and resistance really is?
The problem with Support and Resistance (S&R) is that it is not a definite number. It is not an exact point on the chart at which price will, without any hesitation stop.
In fact S&R is actually an area - it is not an exact number as we would all like to think.
The dilemma of course, is that in order to do our calculations we need an exact point. You can't enter $50.10/20 area when using fibonacci or working out your stops and limits. You need an exact number even though S&R is not an exact number.
Try telling your broker that you want a stop loss at somewhere between 50 and 55 and watch him burst a blood vessel.
This is what I want to concentrate on in this lesson. This is a technique I have found to be particularly good at not only identifying strong S&R points but also swing points.
In order to find S&R we must first identify market swing points. There are various ways of doing this but I am going to use the one I have used for years.
For the purpose of swing points we are not interested in the open or close of the bars only the high and low.
Take any bar and think of that bar as the start bar (S). If there are two consecutive higher highs than the bar you marked (S) then that is a swing up e.g. bar (1) has a higher high than bar (S) and bar (2) has a higher high than bar (1). If there are not two higher highs than bar (S) then you move to the next bar and see if there are two consecutive higher highs.
This can be particularly useful if the market is trading sideways and you are trying to determine the breakout point. There may be many peaks and valleys but for me there is only one real point - that is the most recent swing up or swing down.
Look at the next diagram
You can see that although there were a few highs and lows that you could have taken as support or resistance, but it wasn't until bar (M) that a definite swing point had been identified and you could mark bar (K) with an (S).
Swing Down
To work out the swing down point - take any bar on a chart and think of that bar as your start point - bar (S). If the next two consecutive bars make lower lows than the previous bar then that is a swing down e.g. bar (1) has a lower low than bar (S) and bar (2) has a lower low then bar (1). If there are not two consecutive lower lows then it is not a swing point and you move to the next bar.
Just as in the example above you can see exactly the same thing with the swing down. Even though price made a few highs and lows it wasn't until bar (M) that you could mark bar (K) as the (S) point.
Support And Resistance
Only once we have clearly marker swing points can we go on to identify our support and resistance points.
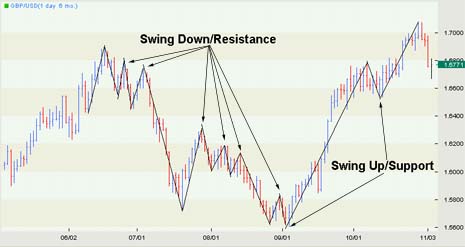
As you can see from the chart I have marked all the swing up points and swing down points. When we are in a down trend then the swing down points act as resistance and when we are in an up trend the swing up points
act as support.
Marking the support and resistance points using this method of first identifying the swing points will give you definite points on a chart from which to calculate your stops, limits and projections.
Good Trading
Best Regards
Mark McRae
==================================================================
Please take some time to visit Mark and see his new project: SureFireTradingChallenge.com.
You are now leaving a Magnifi Communities’ website and are going to a website that is not operated by Magnifi Communities. This website is operated by Magnifi LLC, an SEC registered investment adviser affiliated with Magnifi Communities.
Magnifi Communities does not endorse this website, its sponsor, or any of the policies, activities, products, or services offered on the site. We are not responsible for the content or availability of linked site.