I'm pretty sure many of us fall into the category of impatient trader. I am guilty as charged! I'll spare you the details of the trade but put it this way if I would have held I would have made 15 times my money. Hey I did make 2 times my money so I can't complain...but my impatience got the best of me.
I've asked Dean from ATradersUniverse.com to give us his insight on how to deal with being impatient. ENJOY!
=====================================================================
Your major focus in trading should the softer side of trading, the business and psychological side of it; the harder side which relates more to the technical side is a secondary thought, however in this article I am combining the two because one of my favourite patterns is an ideal pattern for the impatient trader who does not like to hold on to trades for too long.
Impatience is not a good trait to have in the markets when trading or investing. It breeds laziness when it comes to research, planning and analysis, it causes some to exit trades too early, and it causes other’s to constantly monitor their positions. To add to this, trades that linger on can incur costs such as time premium erosion for options traders, and interest costs for CFD traders or stock traders using margin, to name a couple.
Weaknesses are a part of human nature; your job is to ‘manage’ them, not to try and eliminate them or even turn them into strengths. We were brought up to take our weaknesses and try and turn them into strengths which I believe is the wrong approach. Build on your strengths and manage your weaknesses is the best motto I ever heard.
Some traders who don’t like to be in trades for too long will use an exit strategy that will force them out of the trade if the particular stock or market consolidates and moves sideways for a few days, which is a good strategy. Let’s look at an entry technique which is the trading pattern for the impatient trader.
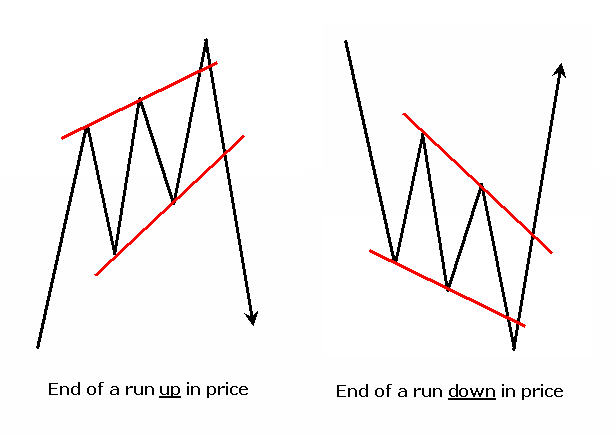
This pattern signals a turning of the market. It does not necessarily signal a top or bottom, it will sometimes just signal a correction, either way; it tells you that a swift and sharp move the other way is imminent, and usually enough to give a good reward to risk. The emphasis here is ‘swift and sharp’, because this is what the impatient trader is looking for.
The pattern unfolds in 5 waves with the highs and lows of the waves overlapping each other to the point where the 5th wave ends in a spike. Here is a diagram showing what to expect at the end of a run up, and the end of a run down.
This is what you need to see and how to trade it:
1. You join the highs of wave 1 and 3 together, and the lows of wave 2 and 4 together if in an up market, and these lines need to converge [or lows of waves 1 and 3, and highs of waves 2 and 4 if in a down market].
2. You want the high of wave 5 to break the upper line and spike [low of wave 5 to break lower line and spike].
3. The break of the lower line is your entry [the break of upper line is your entry].
4. Your stop goes on the other side of the 5th wave.
5. You want your exit or your first profit target to be within the range between the low of wave 1 and wave 2.
6. You shouldn’t take the trade if this range does not offer you at least a reward to risk ratio of 1:1, however this is obviously a personal choice
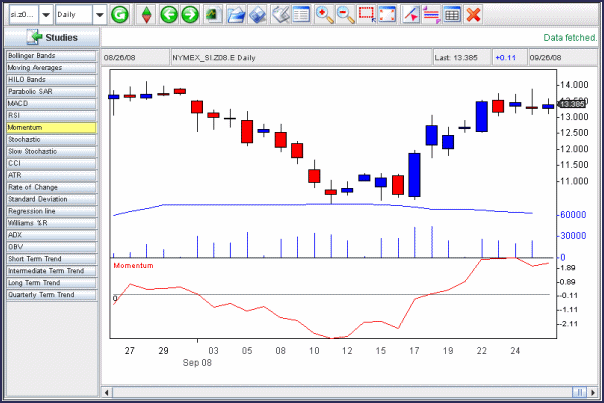
This is an example that occurred on the SP500 index in July 2008 on a 30 minute chart.
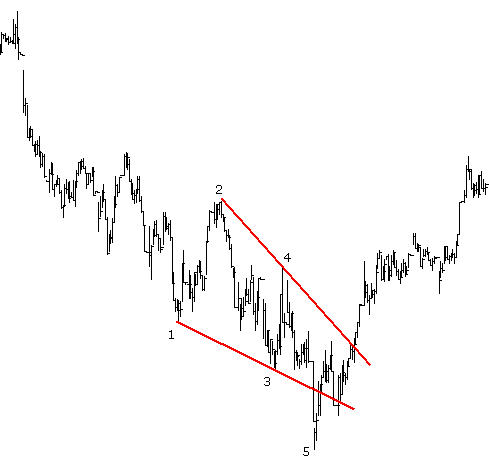
Elliott Wave users will be familiar with this pattern, known as an ending, leading and 5th wave diagonal; others may know it as three drives pattern, and others may just say it’s a wedge pattern.
The point I wanted to make in this article, so as to benefit you is that when these patterns occur they produce swift and sharp moves and this is an obvious benefit to those who don’t like spending too much time in the markets, whether it’s due to being impatient or because of trading instruments that are time sensitive.
Here's a challenge
Who can tell me a currency (or forex pair) where this pattern has occurred very recently?
Here's a clue; the pattern took months to form and only weeks to retrace.
Dean is the owner of ATradersUniverse.com , a resource and education site for traders. He also has a trading system development program which you can find here PentagonalTrading.com.
Dean has also been researching the mind and why traders self sabotage after seeing his parents win the lotto only to lose it all and more. He is giving away a free portion of his ebook discussing the science behind why we fail to succeed, which you can download here:
http://www.atradersuniverse.com/RMFSGiftMC.pdf
==============================================

 Steven Poser is President and Founder of Poser Global Market Strategies Inc., and institutional and retail advisory services firm registered as a CTA with the CFTC which also offers training in technical analysis techniques for trading and analysis professionals. Prior to forming Poser Global Market Strategies Inc., Steven spent nearly eleven years as sole U.S. technical analyst at Deutsche Bank Securities in New York City, sitting, at various times, on the U.S. Government Bond Primary Dealer Desk, the International Bond Desk, and the Currency Desk. Before joining Deutsche Bank, he was a computer analyst for Merrill Lynch Capital Markets and the Western Electric Company, where he helped create the Y2K consulting industry with his Y2K non-compliant coding techniques. He holds a post-graduate certificate in finance, an MBA with a concentration in economics and a BA in mathematics and computer science.