Speculators' Risk Assessments Key to Crude Price Changes

Robert Boslego - INO.com Contributor - Energies


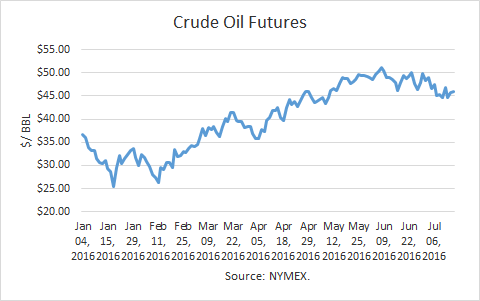
August crude futures prices edged $0.20 higher in the week ending July 12th (to correspond to the data below), closing at $46.80. However, prices are down about 7% since early June when a confluence of events caused supply disruptions in multiple locations.

Crude Oil Prices

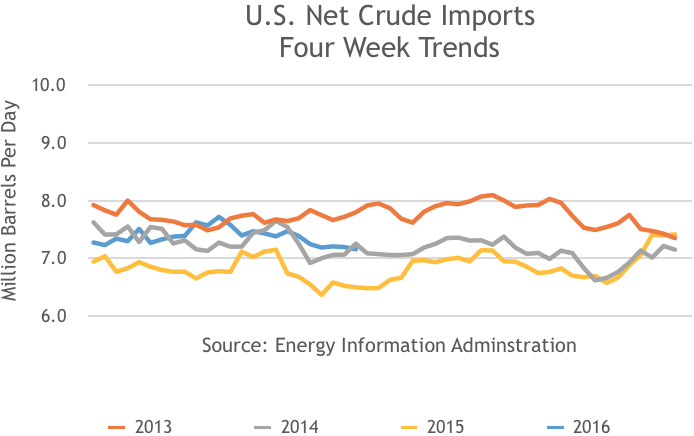
Though U.S. crude oil inventories have dropped more than 20 million barrels since the end of April, petroleum product stocks reached a new peak in the week ending July 8th. Continue reading "Speculators' Risk Assessments Key to Crude Price Changes"

Charting The Energies Data Release

Robert Boslego - INO.com Contributor - Energies


Each week, the Energy Information Administration (EIA) reports estimates for crude oil and petroleum products. These supply, demand and inventory estimates are used by traders to assess the inventory surplus (or deficit), the supply-demand balance and whether the market is tightening or not. The best measure of the latter is to look at the crude stock change and petroleum product stock change graphs.

These stocks and trends are best understood in perspective and so comparisons are made to previous years. Interpreting the data reported by the EIA might otherwise be difficult or time-consuming.

It is important to note that these estimates are provided from surveys and EIA models and are subject to revision. The EIA crude production data, in particular, has been revised substantially in monthly data released a few months after the weeklies.

US Crude Oil Production 4 Week

Other US Energy Supplies

US Crude Production + Other Energy

US Net Crude Oil Imports 4 Week


Continue reading "Charting The Energies Data Release"

Charting The Energies Data Release

Robert Boslego - INO.com Contributor - Energies


Each week, the Energy Information Administration (EIA) reports estimates for crude oil and petroleum products. These supply, demand and inventory estimates are used by traders to assess the inventory surplus (or deficit), the supply-demand balance and whether the market is tightening or not. The best measure of the latter is to look at the crude stock change and petroleum product stock change graphs.

These stocks and trends are best understood in perspective and so comparisons are made to previous years. Interpreting the data reported by the EIA might otherwise be difficult or time-consuming.

It is important to note that these estimates are provided from surveys and EIA models and are subject to revision. The EIA crude production data, in particular, has been revised substantially in monthly data released a few months after the weeklies.

US Crude Production, 4 Week Trend, 2013, 2014, 2015, 2016

Other US Supply Four Week Trends, 2013, 2014, 2015, 2016

US Crude Production and Other Supply, 4 Week Trend, 2013, 2014, 2015, 2016

US Net Crude Imports, 4 Week Trend, 2013, 2014, 2015, 2016


Continue reading "Charting The Energies Data Release"