Worst Performing ETFs in 2019

Earlier in the month, we discussed the Top Performing ETFs of 2019. In this post, we'll discuss the worst performing ETFs of 2019.

After a down year in 2018, the stock market roared back in 2019 despite a number of political headwinds and many market participants calling for a recession to commence during the second half of the year. Fortunately, that never happened and the market shrugged off most of the negative headlines throughout the year since for the most part, economic numbers remained strong and while corporate earnings and revenue growth may be slowing, they are still in positive territory, which is undoubtedly a good sign.

With the S&P 500 (SP500) ending the year up 28.9%, the Dow Jones Industrial Average (DJI) rose 22.3%, and the NASDAQ (COMP) increased by 35.2% in 2019, one may wonder how anyone could have lost money in 2019, but unfortunately, some Exchange Traded Funds and therefore investor, did actually see negative returns during a year when the major indexes all crushed it.

Most investors who ended the year negative may want to forget about what happened. But those investors who focus on understanding why their investments went south are the ones who will learn from their mistakes and hopefully avoid making them in the future. The start of a new year is an excellent time to review your investing thesis and try to pinpoint why some investments didn’t turn out the way you imagined they would. So let’s take a look at the top five worst performing ETFs of 2019 in a number of different categories the average investor had to choose from in 2019 to see if you owned one or more of them.

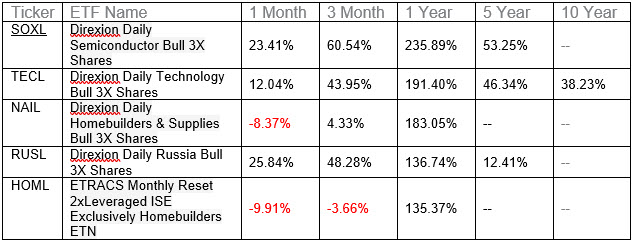
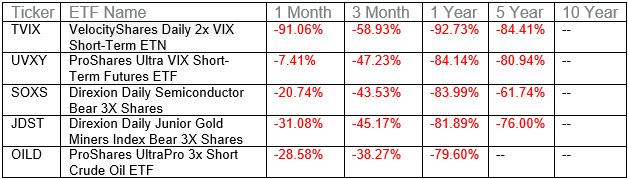
The following table shows the performance of the worst five ETFs in 2019, as well as their performance over the last month, the previous three months, the last five and ten years.

ETFs

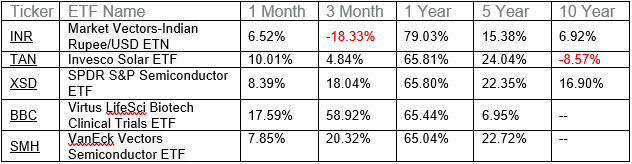
The following table shows the performance of the worst five Non-Leveraged ETFs in 2019, as well as their performance over the last month, the previous three months, the last five and ten years. Continue reading "Worst Performing ETFs in 2019"

Top Performing ETFs in 2019

With the S&P 500 (SPX) ending the year up 28.9%, the Dow Jones Industrial Average (DJI) rose 22.3%, and the NASDAQ (IXIC) increased by 35.2% in 2019, much of the year it felt like no matter what you were invested in you were making money. And for the most part, that was true. Some investors made more than others because they had picked what would become the ETF winners of the year.

Did you see market returns, or were you invested in the ETFs that beat the averages and in some cases by a lot? Let’s take a look at the top five best performing ETFs of 2019 in several different categories the average investor has to choose from.

The following table shows the performance of the top five best performing ETFs in 2019, as well as their performance over the last month, the previous three months, the last five and ten years.

ETFs

The following table shows the performance of the top five Non-Leveraged ETFs in 2019, as well as their performance over the last month, the previous three months, the last five and ten years.

ETFs

The following table shows the performance of the top five Equity Non-Leveraged ETFs in 2019, as well as their performance over the last month, the last three months, the last five and ten years. Continue reading "Top Performing ETFs in 2019"

A Few New Retail ETF Investing Options

Recent data reports and economic indicators have been mixed when it comes to the health of the American consumer. This has led some investors to think retail stocks are undervalued, while other investors believe they are overvalued. So whether you fall into the camp that thinks the next recession is “just right around the corner” or that the poor retail sales figures reported in December were not a sign the economy is struggling, but simply a blip in the data caused because of the government shutdown; there are a few newer Retail ETFs which give you the option to invest regardless of the way you think the market is headed.

The first place to start looking if you want to be long retail is with the SPDR S&P Retail ETF (XRT). The XRT would be most investors first choice if you are looking for plain vanilla long Retail ETF investing. XRT has been around since 2006; it has a lower than average expense ratio, when compared to others on this list, at 0.35%. IT has $250 million in assets, 96 holdings and is equally-weighted and draws stocks from the S&P Total Market Index, not just the S&P 500. It also invests in both e-commerce retailers and brick-and-mortar retailers.

Since most people would agree retails future is more online, the most basic ‘online’ Retail ETF is the Amplify Online Retail ETF (IBUY). IBUY has an inception date of April 20th, 2016, and offers equally weighted, well-diversified exposure to global online retailers. Firms must derive 70% of their revenues from online sales and can be any size in terms of market-cap (subject to the standard typical minimum size and liquidity constraints). The fund has 75% of its assets in US-based companies and 25% in foreign stocks. IBUY has an expense ratio of 0.65%, which is on the ‘high’ side, but considering the exposure the fund offers, it is not unreasonable. IBUY currently has $275 million in assets spread out over its 42 different holdings, which have a weighted average market cap of $52 billion. Wayfair (W), Etsy (ETSY), eBay (EBAY) and PayPal (PYPL) are four of the funds top 10 holdings, with none representing more than 5% of the fund. Continue reading "A Few New Retail ETF Investing Options"

ETF 'Fee War' Could Help You Realize A Larger Portfolio Balance

With more than 2,200 Exchange Traded Funds available to investors, fund managers are now finding that the lower they go in terms of fee’s, the more money they can attract. This isn’t a new idea as it was first spearheaded by the great late Jack Bogle, best known for his work at Vanguard and the man who is largely credited with the first index fund.

Bogle’s idea back then was that if he could get fund fee’s lower, he would be able to attract more money to the fund and therefore, in the long run, make more money for both his clients and his firm. Even decades after Jack changed the game for investment managers by slashing fee’s; Vanguard is still pushing the envelope on how low they can go. Recently the company filed regulatory documents showing that they were cutting the expense ratio on a number of ETFs; Vanguard Total Bond Market ETF BND (BND), Vanguard FTSE All-World ex-US VEU (VEU), Vanguard FTSE Europe ETF VGK (VGK), Vanguard FTSE Pacific ETF VPL (VPL), Vanguard Tax-Exempt Bond ETF VTEB (VTEB), Vanguard FTSE Emerging Markets ETF VWO (VWO) and Vanguard Total International Stock ETF VXUS (VXUS).

The move is the latest in what many have dubbed the ‘fee war’ which is taking place between fund managers. There is currently a handful of ETFs that have expense ratios as low as 0.03% two of which are managed by State Street Global Advisors and another two which are managed by Charles Schwab. There are three times as many ETFs with fees of 0.04%, and more than 150 with fees at or below 0.10%.
Continue reading "ETF 'Fee War' Could Help You Realize A Larger Portfolio Balance"

Micro and Macro Investing Using ETFs

Most people wouldn’t think that investors could use Exchange Traded Funds to invest from both a macro standpoint and from a micro point of view, but due to the increasing number of ETFs now available to investors, this is possible.

First off, what is micro or macro investing?

Macro investing is when you take high-level data points and base your investment strategy on that information. A few examples of high-level data points would be gross domestic product, unemployment stats, US Home Sales stats, current interest rates, consumer confidence, business confidence, the purchasing manager's index, and so on. These data points highlight certain aspects of the economy from the ten-thousand-foot level. The macro picture will tell you how an economy is doing from a very general aspect.

The opposite side of that is micro investing or taking information from much smaller sample sizes and making investment decisions based on that information. A microdata point could be something as small as Apple’s (AAPL) revenue from their most recent earnings report or Amazon.com’s (AMZN) number of Prime Members subscribers. This very small, very direct and specific information will not tell you how the overall US economy is doing, but it would give you a better idea about how Apple or Amazon are faring as opposed to just knowing that the US GDP grew by 3.0% last quarter.

So how would you take macro investment data and put it to use with ETFs? Continue reading "Micro and Macro Investing Using ETFs"