After receiving many requests, I've contacted the team from DayTradeology to help explain how to use MACD AND Forex. Please let me know what you think of the Guest Blog spot.
=================================================================
The MACD (Moving Average Convergence Divergence) is a trend-following momentum indicator that shows the relationship between two moving averages of prices. The MACD is calculated by subtracting the 26-day exponential moving average (EMA) from the 12-day EMA. A nine-day EMA of the MACD, called the "signal line", is then plotted on top of the MACD, functioning as a trigger for buy and sell signals when trading the forex market.
First Some History
Developed by Gerald Appel, Moving Average Convergence/Divergence (MACD) is one of the simplest and most reliable indicators available.
MACD uses moving averages, which are lagging indicators, to include some trend-following characteristics.
These lagging indicators are turned into a momentum oscillator by subtracting the longer moving average from the shorter moving average. The resulting plot forms a line that oscillates above and below zero, without any upper or lower limits.
Benefits of the MACD
One of the primary benefits of MACD is that it incorporates aspects of both momentum and trend in one indicator. As a trend-following indicator, it will not be wrong for very long.
The use of moving averages ensures that the indicator will eventually follow the movements of the underlying security. By using exponential moving averages, as opposed to simple moving averages, some of the lag has been taken out.
MACD Setup
The default settings for the MACD which we will use are:
Slow moving average - 26 days
Fast moving average - 12 days
Signal line - 9 day moving average of the difference between fast and slow.
All moving averages are exponential.
Although there are three moving averages mentioned you will only see two lines. The simplest method of use is when the two lines cross. If the faster signal line crosses above the MACD line ( The MACD line is calculated by the difference between the 26-day exponential moving average and the 12-day exponential moving average) then a buy signal is generated and vice versa.
The higher above the zero both lines are the more overbought it becomes and the lower below the zero line both lines are the more oversold it becomes.
It may also lead to a stronger signal if the signal line crosses down when it is overbought and crosses up when it is oversold.
The last common use of MACD is that of divergence.
If the MACD has made a new low and starts to head up but price continues dow making new lows that is one form of divergence (BULLISH Divergence).
Also, if the MACD has made a high and starts to head down making new lows but price continues up making new highs that is another type of divergence (BEARISH Divergence). This is also referred to as Negative Divergence and is probably the most reliable of the two and can warn of an impending peak.
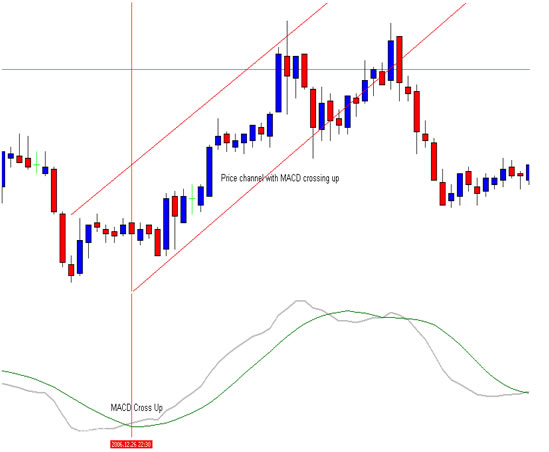
There are many ways to trade the MACD but one of our favorites are too use two different time frames. All we do is establish a trend in a higher time period than the one we intend to trade. For our higher time frame we like to use the 30 min chart and then drop down to the 5 min chart when conditions have been met on the 30 min chart.
On the 30 min forex trading chart below there was a typical buy signal. The chart below (red arrow) shows the fast 9-day signal EMA (gray line) crossing over the MACD line EMA (green line).
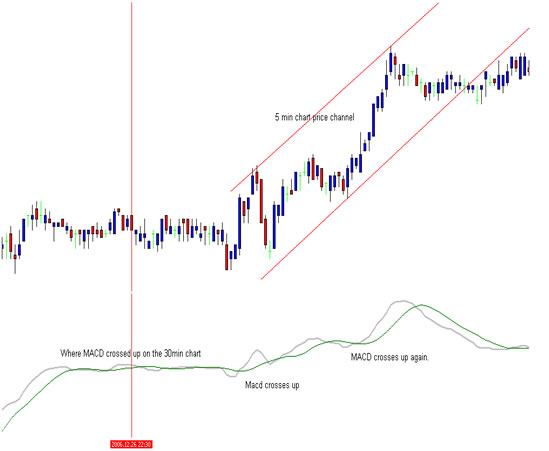
After confirming the signal on the 30 min chart we then dropped to the 5min chart and bought the rallies wherever the MACD crossed up, confident to stay long (to buy) as long as our higher time period MACD trend in the 30 min stayed intact. If the 30 min MACD signal line were to cross down we would have closed all long positions.
Conclusion
The MACD is not particularly good for identifying overbought and oversold levels even though it is possible to identify levels that historically represent overbought and oversold levels. The MACD does not have any upper or lower limits to bind its movement and can continue to overextend beyond historical extremes.
Also the MACD calculates the absolute difference between two moving averages and not the percentage difference. The MACD is calculated by subtracting one moving average from the other. As a security increases in price, the difference (both positive and negative) between the two moving averages is destined to grow. This makes its difficult to compare MACD levels over a long period of time, especially for stocks that have grown exponentially.
With some charts you can set the MACD as a histogram. The histogram represents the difference between MACD and its 9-day EMA. The histogram is positive when MACD is above its 9-day EMA and negative when MACD is below its 9-day EMA.
That having said, the MACD still is and will always be one of the few indicators that all traders love and use daily and in many ways it is an old familiar friend you know you can rely on.
Thank you for joining us in this forex trading lesson.
http://www.daytradeology.com/