You Better Know When To Walk Away

This week’s investor insight will make you think twice about the current stock and bond rally as we head into the end of the year.

We get a lot of questions about if the stock market has bottomed or if it is headed lower and how they can take advantage of the next Major market move. Over the next 6 to 12 months, I expect the market to have violent price swings that will either make or break your financial future. So let me show a handful of charts and show what I expect to unfold.

Let’s dive in.

We’re told that “quitters never win.” But is it always wise to stick with something when it no longer serves us or, worse, continues to harm us?

Many years ago, when Texas hold’em poker was big and online gambling was allowed in Canada, I used to run a poker league and build custom poker tables for people across the United States and Canada. I love poker, and I still play it to this very day, but the game does require skill, a proper mindset, and self-discipline. Without all three of these things, poker is pure gambling. It’s the same when it comes to active trading or investing if you lack the skills, mindset, and self-discipline.

Retired professional poker player Annie Duke, who is also a best-selling author, and decision strategist who advises seed-stage Startups, says that learning when to quit is a critical skill, especially for investors.

Annie states, “Quitting is a good thing when applied at the right time.”

If you’ve been following me for any time, then you know I follow a detailed trading strategy with position and risk management rules. As a result, you won’t find me taking random trades or trading based on emotions. Instead, you’ll find me patiently waiting on the sidelines for a high-probability trade signal to reinvest my capital.

I trade differently. I don’t diversify. I don’t buy-and-hope, and I don’t have any positions at certain times.

What I do is reinvest in assets that are rising in value. And when a particular asset stops moving higher, I give up on the position and exit it immediately. Because I use technical analysis to follow price action, we can quickly and easily determine if an asset is rising or falling. Therefore, I can step aside and let the asset fall and look for a new opportunity that is rising, or hold the falling position and ride it lower for who knows how long…

Unfortunately, most traders and investors do not understand how to read the markets, or they don’t have control of their money. They are at the mercy of what the market does or the skills of whoever controls their capital. Continue reading "You Better Know When To Walk Away"

ETFs - How They Help Build Wealth

The idea of pooling investment assets has been around for centuries. Mutual Funds first appeared in the 1920s. But it wasn’t until the 1980s that mutual funds became widely popular with mainstream investors.

In recent years, ETFs have taken off as an alternative to mutual funds.

An exchange-traded fund (ETF) is a “basket” of stocks, bonds, or other financial instruments that gives convenient exposure to a diverse range of assets. ETFs are an incredibly versatile tool that can track anything from a particular index, sector, or region to an individual commodity, a specific investment strategy, currencies, interest rates, volatility, or even another fund.

You can do about anything with them — hold a diversified portfolio, hedge, focus on a particular sector, or even profit in a bear market.

The most significant practical difference between mutual funds and ETFs is that ETFs can be bought and sold like individual stocks — and mutual funds cannot. Mutual funds can only be exchanged after the market closes and their Net Asset Value (NAV) is calculated. Shares of ETFs can be traded throughout regular market hours, like shares of stock.

Both mutual funds and ETFs have expense fees that can range from low to high. Mutual funds can have front or backend loads or redemption fees in addition to management fees.

ETFs that trade like shares have commissions to buy and sell. But some ETFs are so popular that brokers offer commission-free trading in them.

So Many Choices

The sheer number and variety of ETFs can be a bit mind-boggling. Over the last 20 years, we’ve seen just a couple hundred ETF offerings grow to more than 8,000 worldwide, encompassing more than 10 trillion in assets.

A surprising number of ETFs have failed. They started with an interesting focus (well, “interesting” to somebody) but failed to attract enough interest to remain viable. For this very reason, I avoid narrow niche ETFs that trade with low volume.

I eliminate many ETFs on poor liquidity alone. I’m not interested if there’s not much volume in a product. I don’t want to suffer high slippage from wide bid/ask spreads. I want to get in and out quickly and at fair prices. Continue reading "ETFs - How They Help Build Wealth"

The Excess Phase Peak Pattern

The Excess Phase Peak pattern is a very common transitional phase for the markets where psychology and economic trends shift over time. Global markets typically require periods of pause, reversion, or a reset/revaluation event to wash away excesses.

We’ve seen these types of setups happen near the DOT COM and 2007-08 market peaks. What happens is traders are slow to catch onto the shifting phases of the Excess Phase Peak and sometimes get trapped thinking, “this is the bottom – time to buy.”

The reality is that as long as the individual phases of the Excess Phase Peak continue to validate (or confirm), then we should continue to expect the next phase to execute as well. In other words, unless the Excess Phase Peak pattern is invalidated somehow, it is very likely to continue to execute, resulting in an ultimate bottom in price many months from now.

The 5-Phases Of The Excess Phase Peak Pattern

The Excess Phase Peak Pattern starts off in a very strong rally phase. This rally phase normally lasts well over 12 to 24 months and is usually driven by an extreme speculative phase in the markets.

Once a price peak is reached and the markets roll downward by more than 7~10%, that’s when we should start to apply the five unique phases of the Excess Phase Peak Pattern. If each subsequent phase validates after the peak, then the Excess Phase Peak Pattern is continuing. If any phase is invalidated, then the pattern has likely ended.

For example, if we start by completing Phase #1 & #2, then the market rallies to a new all-time high – that would invalidate the Excess Phase Peak Pattern.

Here are the Phases of the Excess Phase Peak Pattern:

  1. The Excess Phase Rally Peak
  2. A breakdown from the Excess Phase Peak sets up a FLAG/Pennant recovery phase.
  3. Sets up the Intermediate support level – the last line of defense for price.
  4. Price retests #3 support & breaches the support level – starting a new downtrend.
  5. The final breakdown of the price is below the Phase 4 support level. This usually starts a broad market selling phase to an ultimate bottom.

Continue reading "The Excess Phase Peak Pattern"

Are Technology And FANG Stocks Bottoming?

Recent downside pricing pressure on Technology and FANG stocks have kept investors wary of jumping back into the market while we wait to see where the bottom may form. Concerns about long-term pricing pressures, US trade wars and the continued Congressional testimony regarding privacy and censorship issues have kept social media technology stocks in a negative perspective. The only aspect of this pricing pullback that is positive is that these stocks will, at some point, find a price bottom and attempt to rally as investors rush back into their favorites attempting to ride the run higher.

Our researchers believe the current price levels could be a prime example of a short-term bottom setting up in certain technology stocks. Both Apple and Amazon are two of the biggest and most actively traded stocks on the US Stock exchange. They differ from many of the other FANG stocks because these companies actually produce and sell consumer products & services that are, in many ways, essential to conducting commerce and trade.

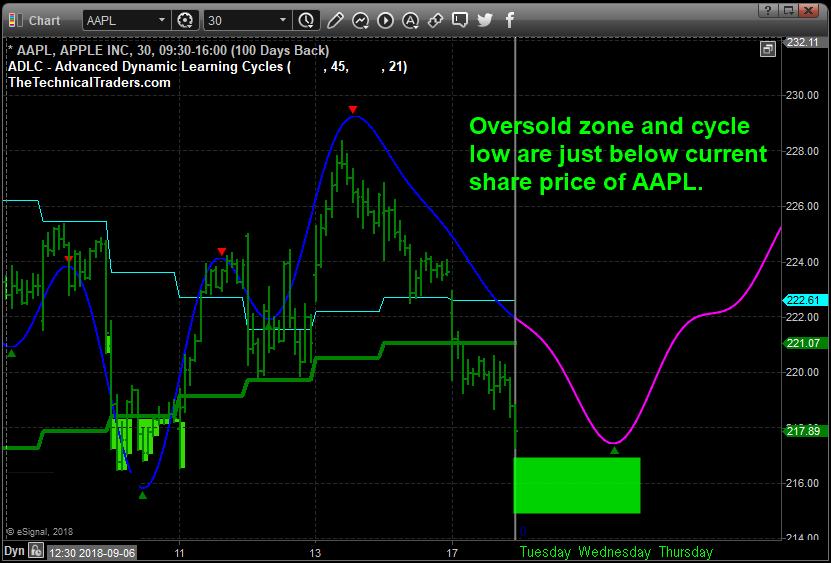
This 30-minute chart of Apple shows our Adaptive Dynamic Learning Cycles price modeling system showing a cycle low is setting up over the next day or two in Apple followed by an upside price cycle that should push prices back above $220. Notice the oversold levels highlighted in BRIGHT GREEN. The last major oversold levels setup just below $218. The current oversold levels are setting up just below $217. We believe these $217 levels will likely set up a price bottom and prompt an upside price rally over the next 5+ days that could push Apple prices well above $225.

FANG Stocks

Amazon is setting up a different type of price bottoming formation – a Fibonacci price retracement bottom. We use these Fibonacci price retracement levels in conjunction with our other price modeling systems to attempt to determine where and when price reversals may be set up in the future. In this example, we can see a price bottom formed in early August of a Fibonacci 50% price pullback and the current price pullback is testing the same 50% level. We believe this current setup will prompt a price bottom to form and an upside price rally will likely result in AMZN rushing back above $2000 again with a few days. Continue reading "Are Technology And FANG Stocks Bottoming?"