Nvidia vs. Netflix- Which Is the #1 Growth Stock to Buy in March?

With the S&P 500 soaring roughly 8% year-to-date, stocks have experienced a solid start in 2024, with investors reaping the rewards of putting their money in high-growth stocks. This positive momentum is expected to persist throughout the rest of the year and beyond.

Amid this market rally, chip giant NVIDIA Corporation (NVDA) and entertainment powerhouse Netflix, Inc. (NFLX) have emerged as beacons of growth, capturing investor’s bullish sentiment.

Although operating in distinct industries with unique business models, these titans share striking parallels in their journey to success. Their unwavering commitment to excellence, combined with strategic flexibility, has catapulted them to the forefront of their respective industries.

Therefore, let’s explore the fundamentals of NVDA and NFLX to unveil the ultimate growth contender of the month.

Last Reported Quarterly Results

In the fiscal fourth quarter that ended January 28, 2024, NVDA witnessed a staggering 265.3% year-over-year surge in its topline, totaling $22.10 billion. The company’s non-GAAP net income surged to $12.84 billion and $5.16 per share, marking a remarkable increase of 490.6% and 486.4% from the prior-year quarter, respectively.

As of January 28, 2024, NVDA’s cash, cash equivalents and marketable securities stood at $25.98 billion.

Conversely, for the fourth quarter that ended December 31, 2023, NFLX’s revenue rose 12.5% year-over-year to $8.83 billion. The company also experienced significant growth in net income and EPS compared to the previous year’s quarter, amounting to $937.84 million and $2.11, respectively. As of December 31, 2023, NFLX held $7.12 billion in cash and cash equivalents.

Growth Trajectory

NVDA, the reigning chip powerhouse, is currently one of the market's most sizzling stocks. Since its inception in 1993, NVDA has spearheaded cutting-edge computer chip technology, pushing the boundaries of graphics-heavy video games to unparalleled heights.

However, with the emergence of Artificial Intelligence (AI), these chips have swiftly ascended to newfound prominence, reflecting NVDA's enduring innovation and strategic adaptability. The company stands as a global giant in the production of Graphics Processing Units (GPUs) renowned for their ability to handle complex mathematical operations, powering captivating visuals across devices.

These advanced chips have become indispensable for training state-of-the-art AI programs such as ChatGPT and Gemini, underscoring NVDA’s pivotal role in driving the AI revolution forward. Leveraging AI to its advantage, NVDA’s earnings reports have managed to exceed expectations throughout 2023.

Furthermore, NVDA’s shares soared roughly 200% over the past year, buoyed by the company’s stellar earnings performance and solid demand for its AI chips. This surge attracted both institutional and retail investors, driving up share prices. With a market cap of around $2 trillion, NVDA has now claimed the title of the world's third most valuable company.

On the other hand, commanding a market cap of over $268 billion, NFLX stands as a pioneer in the streaming entertainment space, revolutionizing how audiences consume content worldwide. With a vast library of original programming and a global subscriber base, NFLX enjoys unrivaled dominance in the industry.

In a recent conference, NFLX’s CFO Spencer Neumann elaborated on NFLX’s trajectory under its revamped Co-CEO structure and its ambitious vision for future expansion. Neumann emphasized the smooth transition to the new leadership structure and NFLX’s dedication to broadening its entertainment repertoire, spanning films, TV series, gaming endeavors, and live content experiences.

Over the last few years, the tech company has adopted several strategic approaches to bolster its financial health. NFLX’s growth strategy hinges significantly on its substantial investment in content, with an annual expenditure projected at approximately $17 billion.

In addition, Netflix is venturing into new revenue avenues, including the introduction of an ad-supported subscription tier and measures aimed at bolstering monetization, such as combating password sharing.

Moreover, despite its risky move of cracking down on password sharing, NFLX’s latest earnings report revealed a surge of 13 million new subscribers in the final quarter of 2023, marking its most substantial growth since 2020. While initially met with resistance, the strategic move has been designed to counteract declining subscribership.

Greg Peters, NFLX’s Managing Director, emphasized during the earnings call that the company's top priority regarding ads is scalability. He highlighted a 70% quarter-on-quarter growth in the last quarter, following a similar growth trend in the previous quarter, indicating a positive growth trajectory for the company.

Competitive Landscape

In the dynamic worlds of technology and entertainment, both NVDA and NFLX are fiercely vying for supremacy in their domains.

The soaring popularity of generative AI owes a significant debt to NVDA and its groundbreaking GPUs. With skyrocketing demand and tight supply, NVDA's GPU H100 has emerged as a highly sought-after and premium-priced commodity, propelling NVDA to trillion-dollar status for the very first time.

With tech giants such as Microsoft Corporation (MSFT), Meta Platforms Inc. (META), OpenAI, Amazon.com Inc. (AMZN), and Alphabet Inc. (GOOGL) heavily relying on NVDA’s GPU chips to power their generative AI planforms, these companies have started developing their own AI processors.

In addition, NVDA faces stiff competition from other chip makers like Advanced Micro Devices, Inc. (AMD) and Intel Corporation (INTC), all striving to release the newest, most efficient, and potent AI chips to dominate the market.

Meanwhile, NFLX confronts fierce competition from fellow FAAMG (Meta (formerly Facebook), Apple Inc. (AAPL), Amazon, Microsoft, and Alphabet’s Google) heavyweights. The streaming arena is now brimming with contenders like Apple TV+, Amazon Prime Video, and YouTube Premium, launched by Apple, Amazon, and Google, respectively.

This fierce rivalry compels NFLX to perpetually innovate and enrich its content library to retain its crown as the streaming kingpin. Furthermore, the mounting expenses of content licensing and the delicate balance between original productions and licensed content present enduring hurdles for NFLX to overcome.

Bottom Line

As evidenced by their latest quarterly results, both NVDA and NFLX continue to deliver impressive performances, standing as formidable players in their respective industries, with their growth trajectories reflecting their strategic prowess and market dominance.

NVDA's cutting-edge GPU chips have propelled it to the forefront of the AI revolution, with staggering earnings growth and market capitalization making it a top contender in the tech landscape.

Fueled by these promising prospects, NVDA’s shares soared to unprecedented heights last month, with its market cap skyrocketing by a Jaw-dropping $267 billion in a single day. This remarkable surge nearly matched the entire market cap of NFLX, reflecting immense investor confidence in NVDA’s prospects.

NFLX, on the other hand, dominates the streaming entertainment space with its vast content library and global subscriber base. Despite facing stiff competition from tech giants and emerging streaming platforms, NFLX remains focused on expansion and innovation, which is evident in its ambitious growth strategies and robust financial health in the last reported quarter.

While challenges and competition persist, NVDA and NFLX demonstrate resilience, adaptability, and a relentless drive for success, making them compelling options for investors seeking growth opportunities in the dynamic worlds of technology and entertainment.

However, NVDA’s shares are trading at a much higher valuation than NFLX. For instance, in terms of forward Price/Sales, NVDA is trading at 19.37x, 178.7% higher than NFLX’s 6.95x. Likewise, NVDA’s forward Price/Book ratio of 24.32 is 116.2% higher than NFLX’s 11.25x.

The higher valuation of NVDA compared to NFLX indicates investor confidence in NVDA's future growth potential, leading investors to be willing to pay a premium price for its shares. However, it also signals that NVDA's anticipated growth might already be factored into its stock price, potentially dimming its attractiveness compared to NFLX.

Furthermore, while NVDA’s ascent captivates the stock market and propels the S&P 500 Index to unprecedented highs, Barclays research analyst Sandeep Gupta anticipates that demand for AI chips will stabilize once the initial training phase concludes.

Gupta underscores that during the inference stage, the computational demand is lower compared to training, suggesting that high-powered PCs and smartphones could suffice for local inference tasks. Consequently, this scenario may reduce the urgency for NVDA’s expanding GPU facilities.

As a result, investors might be banking on future growth that could potentially fail to materialize. With that being said, NFLX may emerge as a more promising growth stock compared to NVDA.

6 Stocks to Invest in if There’s Another Rate Hike

Today, on August 31, the initial jobless claims for the week ending August 26 came in at 228,000, below market expectations of 235,000, thereby registering its lowest reading in four weeks.

This has followed further signs of economic slowdown in the form of JOLTS, which showed an unexpected drop in job openings to below 9 million for the first time since March 2021, the latest consumer confidence index, which came in at 106.1, lower than the previous Dow Jones estimate of 116 which was lower-than-expected addition of 177,000 jobs in August according to private payroll data from ADP, and a downward revision in the GDP growth rate for the second quarter.

However, such disappointing updates have been welcomed by market participants spooked by Fed chair Jerome Powell’s message at Jackson Hole in Wyoming on Friday, August 25.

While it was not as brief as last year’s, it was still equally unambiguous. 2% still remains the non-negotiable target for the inflation rate, and the Central Bank is prepared to raise policy rates further if required and hold them higher for longer until it is confident of sustained price stability.

While the 12-month PCE has since declined to 3% percent as of July from its peak of 7% in June 2022 due to a significant unwinding of the demand-supply imbalance, however, the core PCE, which excludes volatile food and energy prices and includes inflation for goods, housing services, and all other services, came in at 4.3% in July, indicating that there is significantly more ground left to cover through monetary policy tightening.

In such a scenario, despite increased optimism, businesses are expected to remain weighed down by high borrowing costs, and economic activity is expected to remain stifled due to relatively scarce credit.

Moreover, with every increase in benchmark interest rates, a selloff of long-duration fixed-income instruments, such as the 10-year treasury notes, gets triggered, which causes a slump in their market value and a consequent increase in their yields. This also increases the benchmark 30-year mortgage rates, thereby depressing demand and deepening the crisis in which real estate has lately been finding itself.

An increase in borrowing costs would not just raise the cost of servicing the $32.7 trillion national debt; significant markdowns and prices of legacy bonds could crush the loan portfolios of banks that could share the same fate as the Silicon Valley Bank and the First Republic Bank. In this context, S&P's move to downgrade multiple U.S. banks citing ‘tough’ operating conditions hardly comes as a surprise.

Speaking of banks, the Bank of Japan’s policy tweak loosened its yield curve control, sparking widespread shock in the markets. To compound the miseries further, after placing the country on negative watch amid the debt-ceiling standoff at Capitol Hill back in May, Fitch Ratings recently downgraded U.S. long-term rating to AA+ from AAA, citing the erosion of confidence in fiscal management.

While broad expectations are pricing in a rate hike in November after a pause in September’s FOMC meeting, being diligent investors confident enough to increase their stakes in fundamentally strong businesses could be a time-tested method to navigate potential turbulence ahead.
Here are a few which could be worthy of consideration:

Amazon.com, Inc. (AMZN)

The global retail giant provides its consumers a wide range of products and services through its online platform and offline supply chains. In addition to reselling merchandise and content offered by third-party resellers, the company also manufactures electronic devices to distribute its service. It operates through three segments: North America, International, and Amazon Web Services (AWS).

The AWS segment consists of global sales of computing, storage, databases, and other services for start-ups, enterprises, government agencies, and academic institutions. Recently, at the AWS Summit in New York, San Francisco-based cloud communication and customer engagement platform Twilio Inc. (TWLO)announced its strategic partnership with the company.

The renewal of vows and strengthening of ties, which seeks to enhance the company’s predictive AI proficiency, has closely followed a vote of confidence from the tech giant in which AMZN announced that it has acquired 1% stake in TWLO earlier in the week with its ownership of 1.77 million shares worth more than $108 million.

During the fiscal 2023 second quarter that ended June 30, AMZN’s net sales increased 11% to $134.4 billion, while its operating income more than doubled to $7.7 billion. Consequently, the behemoth’s net income came in at $6.7 billion, or $0.65 per share, compared to a net loss of $2 billion, or $0.20 per share, during the previous quarter.

Exxon Mobil Corporation (XOM)

XOM is engaged in the energy business through exploration for and production of crude oil and natural gas and the manufacture, trade, transport, and sale of crude oil, natural gas, petroleum products, petrochemicals, and a range of specialty products. The company’s segments include Upstream; Downstream; and Chemicals.

Over the past three years, XOM’s revenue has grown at a 19.8% CAGR. Over the same time horizon, the company’s EBITDA and net income have grown at 50.8% and 93.2% CAGRs, respectively.

On July 13, XOM announced the acquisition of Denbury Inc. (DEN), an experienced developer of carbon capture, utilization, and storage (CCS) solutions and enhanced oil recovery. The acquisition is an all-stock transaction valued at $4.9 billion, or $89.45 per share, based on XOM’s closing price on July 12, 2023.

During the fiscal 2023 second quarter that ended June 30, XOM’s total revenue and other income came in at $82.91 billion. During the same period, the net income attributable to it came in at $7.88 billion, or $1.94 per share.

T-Mobile US, Inc. (TMUS)

Through its flagship brands, T-Mobile and Metro by T-Mobile, TMUS provides mobile communication services in the United States, Puerto Rico, and the United States Virgin Islands.

Over the past three years, TMUS’ revenue has grown at almost 15% CAGR. During the same time horizon, its EBITDA and net income have grown at 19.4% and 31.8% CAGRs, respectively.

On the 5G front, on August 15, TMUS expanded its coverage in Pennsylvania, while on August 17, the company expanded its REVVL lineup with its first-ever tablet and new 5G smartphones.

For the fiscal 2023 second quarter, TMUS’ and postpaid service revenues registered industry-leading growth rates of 2.8% and 5.5%, to come in at $15.7 billion and $12.1 billion, respectively. The company’s adjusted EBITDA increased by 5.7% year-over-year to $7.20 billion during the same period.
Consequently, its net income for the quarter came in at $2.22 billion, or $1.86 per share. With the expectation of adding a net 5.6 to 5.9 million customers compared to the earlier estimate of 5.3 million to 5.7 million, TMUS has revised its core adjusted EBITDA guidance upwards to a range between $28,900 and $29,200.

The Progressive Corporation (PGR)

As an insurance holding company, PGR operates throughout the U.S. through three segments: Personal Lines; Commercial Lines; and Property. The company’s non-insurance subsidiaries generally support its insurance and investment operations.

Over the past three years, PGR’s revenue and total assets have grown at 11.3% and 11.8% CAGRs, respectively. For the fiscal 2023 second quarter that ended June 30, PGR’s total revenue increased by 33.3% year-over-year to $15.35 billion. During the same period, the net income available to common shareholders came in at $335.9 million, or $0.57 per share, compared to the net loss of $549.6 million, or $0.94 per share.

Albemarle Corporation (ALB)

As a global developer, manufacturer, and marketer of specialty chemicals, ALB operates through three segments: Energy Storage, Specialties, and Ketjen.
Given the ALB’s burgeoning lithium mining operations in Latin America coinciding with the exponential increase in demand and price of white gold driven by the imperative of energy transition, the company’s revenue has ballooned at 42% CAGR over the past three years. During the same time horizon, its EBITDA and net income have increased at 61.5% and 107.5% CAGRs, respectively.

On July 19, ALB announced that it had agreed to amend the transaction terms signed earlier this year with Mineral Resources Limited (MALRF). Pending regulatory approvals, under the new agreement, ALB will take 100% ownership of the Kemerton lithium hydroxide processing facility in Australia that is currently jointly owned with MALRF through the MARBL joint venture. ALB will also retain full ownership of its Qinzhou and Meishan lithium processing facilities in China.

The amendment is expected to simplify commercial arrangements further and provide greater strategic opportunities for each company based on its global operations and the evolving lithium market.

On July 18, ALB announced its quarterly dividend of $0.40 per share, payable October 2, 2023, to shareholders of record at the close of business as of September 15, 2023. ALB currently pays $1.60 annually as dividends and has been able to increase its payouts for the past 28 years.

For the fiscal 2023 second quarter that ended June 30, ALB’s net sales increased by 60.2% year-over-year to $2.37 billion, while its adjusted EBITDA increased by 69.2% year-over-year to $1.03 billion. Consequently, the net income attributable to ALB increased by 59.8% year-over-year to $650 million, while its adjusted EPS increased by 112.5% year-over-year to $7.33.

Given the stellar performance, ALB raised its revenue and EPS guidance for the fiscal year to $10.4 - $11.5 billion and $25.00 - $29.50, in line with the current analyst estimates.

Coterra Energy Inc. (CTRA)

As an independent oil and gas company, CTRA is involved in developing, exploring, and producing oil, natural gas, and natural gas liquids (NGLs). The company’s operations are primarily concentrated in three areas: the Permian Basin in west Texas and southern New Mexico; the Marcellus Shale in northeast Pennsylvania; and the Anadarko Basin in the Mid-Continent region in Oklahoma.

Over the past three years, CTRA’s revenue has grown at a 70.9% CAGR. Over the same time horizon, the company’s EBITDA and net income have grown at 88.9% and 113.2% CAGRs, respectively.

During the fiscal 2023 second quarter that ended June 30, CTRA’s operating revenue came in at $1.19 billion, while its adjusted net income came in at $291 million, or $0.39 per share. Given the outstanding operational execution, the company has increased its 2023 BOE and natural gas production guidance by 2% and oil guidance by 3% at the mid-point.

Amazon Chart Presents Buying Opportunity

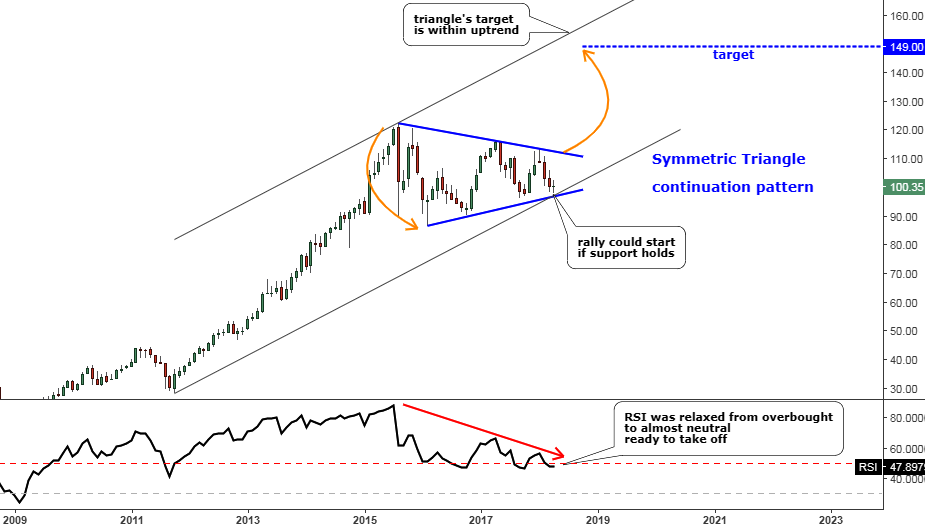
In April 2018, I published the post with the title “Disney Could Rally After A Long Pause”. I spotted an interesting long setup on the Disney (DIS) chart that time. Below is that monthly chart of Disney stock with the bullish setup.

Disney

The combination of higher tops and higher lows has shaped the famous Triangle (Symmetric) pattern highlighted in blue.

The neutral position of the relaxed RSI indicator and the double trendline support on the chart facilitated the bullish opportunity. The target was set at the equal distance of the widest part of the pattern added to the breakout point. It was located at $149 with a potential gain of 50% as the stock was traded around $100.

We can see how it played out in the next chart. Continue reading "Amazon Chart Presents Buying Opportunity"

Amazon's October Drop Hurting ETFs

Most recent data shows 246 different Exchange Traded Fund’s owned more than 24.7 million shares of Amazon.com (AMZN). But, the companies recent 20.9% decline in the month of October alone, (Amazon opened October trading at $2,021 per share and closed the month trading at $1,598 per share, or a 20.9% decline) has certainly had an effect on not only those 246 different ETFs and their investors, but also those investors whom may have directly purchased shares of the company. Furthermore, due to its market capitalization, it was a very heavily weighted stock in some large ETFs, which makes its recent decline even more painful.

Some of the hardest hit ETFs over the last month was the SPDR S&P 500 ETF Trust (SPY) because Amazon was its second, now third, largest holding and SPY was the single largest owner of Amazon stock. ProShares Online Retail ETF (ONLN) had 22% of its assets in Amazon as of late, while the Vanguard Consumer Discretionary ETF (VCR) and the Consumer Discretionary Select Sector SPDR Fund (XLY) both had more than 20% of their assets in Amazon.

Throughout the ETF world, there where eight different ETFs which had more than 10% of their assets in Amazon in recent weeks. Most were in the consumer discretionary sector, but a few internet focused ETFs such as the Invesco QQQ ETF (QQQ), and the First Trust Dow Jones Internet Index ETF (FDN) had more than 9% of their assets in Amazon. Continue reading "Amazon's October Drop Hurting ETFs"

Are Technology And FANG Stocks Bottoming?

Recent downside pricing pressure on Technology and FANG stocks have kept investors wary of jumping back into the market while we wait to see where the bottom may form. Concerns about long-term pricing pressures, US trade wars and the continued Congressional testimony regarding privacy and censorship issues have kept social media technology stocks in a negative perspective. The only aspect of this pricing pullback that is positive is that these stocks will, at some point, find a price bottom and attempt to rally as investors rush back into their favorites attempting to ride the run higher.

Our researchers believe the current price levels could be a prime example of a short-term bottom setting up in certain technology stocks. Both Apple and Amazon are two of the biggest and most actively traded stocks on the US Stock exchange. They differ from many of the other FANG stocks because these companies actually produce and sell consumer products & services that are, in many ways, essential to conducting commerce and trade.

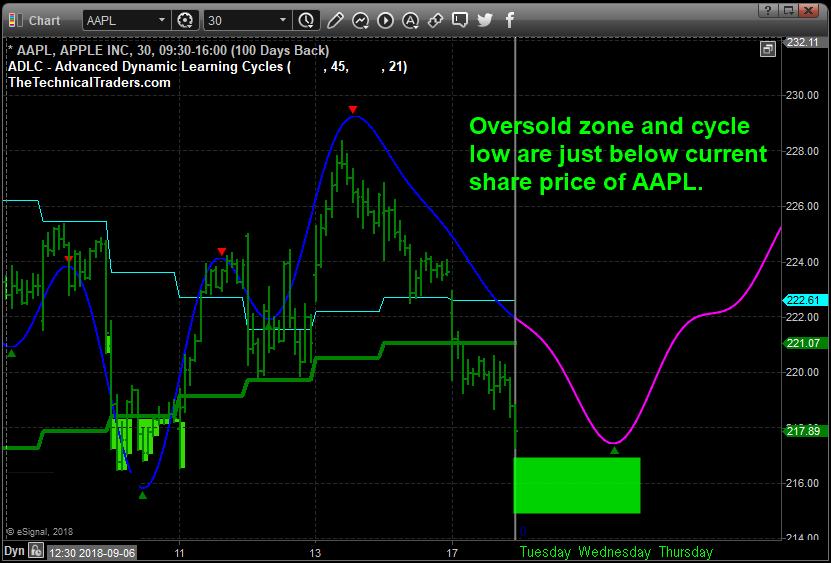
This 30-minute chart of Apple shows our Adaptive Dynamic Learning Cycles price modeling system showing a cycle low is setting up over the next day or two in Apple followed by an upside price cycle that should push prices back above $220. Notice the oversold levels highlighted in BRIGHT GREEN. The last major oversold levels setup just below $218. The current oversold levels are setting up just below $217. We believe these $217 levels will likely set up a price bottom and prompt an upside price rally over the next 5+ days that could push Apple prices well above $225.

FANG Stocks

Amazon is setting up a different type of price bottoming formation – a Fibonacci price retracement bottom. We use these Fibonacci price retracement levels in conjunction with our other price modeling systems to attempt to determine where and when price reversals may be set up in the future. In this example, we can see a price bottom formed in early August of a Fibonacci 50% price pullback and the current price pullback is testing the same 50% level. We believe this current setup will prompt a price bottom to form and an upside price rally will likely result in AMZN rushing back above $2000 again with a few days. Continue reading "Are Technology And FANG Stocks Bottoming?"