
Perfect Portfolio Update
The month of October produced solid gains for The Perfect Portfolio. The four markets we track in this portfolio are all ETF's. We believe that this is a very conservative portfolio and one that will produce excellent returns in the next 36 months.
So how did we do in October?
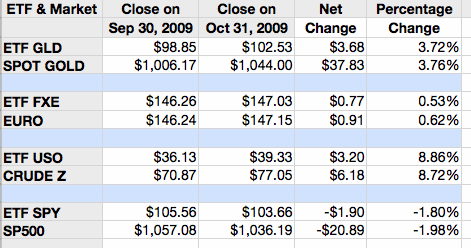
The big winner for us was USO, the ETF that tracks crude oil. This market produced our best return of the month with a gain of 8.86%. Next in line was the gold ETF, GLD. This particular market produced a gain of 3.72%. Third is the ETF market that tracks the Euro symbol, FXE. This market showed a modest gain of .53% for the month. The only loser for the month was the ETF that tracks the S&P 500. You may remember that this market was slammed on the last day of trading in October. Nonetheless, the loss in this market was a modest 1.8%.
Collectively The Perfect Portfolio produced a monthly return of 2.8%. Given the volatility in the last week of trading we are very happy with this positive return.
Please see the ETF numbers below and the markets they track.
We will be posting these numbers every month so you will be able to follow along and track our progress.
You may want to watch our Perfect Portfolio video if you've not seen it before. Here's the link.
All the best,
 Adam Hewison
President, INO.com
Co-creator, MarketClub
Hi Adam,
I'm not quite clear on the shorting part of the trade triangles. When the SAR triangle appears and indicates an exit from an uptrend position, do you then actually buy into a short position? I think that is what I understand you to say in the explanation of SPY through 2008 (up 7%+ for 42 months)that you just referred someone to for a "back test" of the system.
If not, why not?
If so, you never mention (unless I missed it), what symbols you use to short. As a for instance, I can't find a short ETF for the Euro unless it is leveraged to double the actual performance (Profunds Ultra). Also a gold ETF is hard to find unless it is on the British Exchange. So how do you short these? SH for SPY? DNO for USO? DGZ (an ETN) or SBUL (Brit.) for GLD? SZO (ETN) or DNO (ETF) for USO?
Also, if you do actually short, should I assume that you use all of the exit money at each point to reinvest in the opposite direction?
Thanks.
Donn,
Thank you for your feedback.
It is possible to short an ETF if the stock is available. To answer your other question, our results show the same amount of money in the market at all times. Had you added your profits the results would have been significantly higher dollar wise but the percentage gains on that particular would be the same.
The Perfect Portfolio is set up and is conservative in nature ... one can reinvest ones profits, but that is not what we are showing in our examples of The Perfect Portfolio.
Every success,
Adam
J Follis,
Thank you for your feedback.
The Perfect Portfolio is simple to implement and does not need to be looked at every single day. This approach which uses our monthly trade triangles does not take into consideration any fundamentals.
Historically there is very little activity/turnover as it is a long-term approach to trading.
I hope this addresses and answers your question.
All the best,
Adam
The Perfect Portfolio seems like an ideal way to invest for the long term. When using this strategy, can youi simply go long or short the ETF's when getting a new Monthly trade triangle? Are there other considerations needed to be made when a signal occurs or can you feel pretty confident that if a monthly signal is given, you can place the corresponding order?
Also, is there a general rule of thumb for the number of monthly triangle trades given in a "usual" year? Is it possible to use the technology to place trades in a 401k account where you are limited in the number of trades placed annually?
On a post I read today, you stated that the Perfect Portfolio was averaging 6% returns.....a MONTH! Can you provide the year end results for 2009? How about 2008? I'd like to see how the returns compared in a poor market year (2008) and a good one (2009).
Jeff,
Check out this link to The Perfect Portfolio.
http://broadcast.ino.com/education/perfect_portfolio/
Thanks,
Adam
Hi Adam,
Firstly i would like to thank you for the educational material you have provided for free as it is very useful, especially the triangle trend and algorithm that lies beneath it. I shall definately be signing up in the next few days and see if this program is useful to me.
What caught my attention most, is you technical analysis of gold prices. I found the exact same trends in my own analysis and forecast it to reach at least $3000/oz by around october 2011! I find it odd that the trends are so predictable. Whilst i am a amateur at this, having trading for 7 months using virtual money to practise, i have come to the conclusion that certain market participants have a high degree of control of prices, cough cough. what is your view adam?
Also, have started looking at trends in data as evrything is connected, in partiuclar i have been looking at geo-politics, history ,economics, behaviour analysis,social movements, key decision makers and other entities and hope to use data mining techniques to analyse them to some extent. I am very worried for your country(im from the uk).It is of my opinion that the dollar is going to collapse and is just being propped up by stimilus money and fake confidence and with no manufacturing and production base the working class and middle class will be hit hard, trade barriers will be implemented, food prices will soar and hyperinflation. the only way i see america remaing stable and prospering is if an amazing new innovation was discovered which required alot of human capital. I do not think that the prices of gold and oil are actually up, but actually the purchasing power of the dollar is diminishing and this is going to create tidal waves round the world. What is your view and how will that effect the prices of these commodities, in partiuclar oil? New currency? I assume gold and silver will go rocketing into the sky.
Sorry for the pessimistic opinion, i hope for all our sakes, i am wrong.
Aneek,
Thank you for your feedback.
All markets exhibit certain characteristics and gold is no exception. The key to being successful in the markets is discovering these characteristics early and being able to capitalize on them in a positive way.
Every success on your journey.
Adam
Hi
I wonder is it possible to see all these trades in progress, to see the entry and exit points, when they are added to etc. I'd like to be able to folow them as I have a brialliant ability to pick a trade that I think wil go up and it tanks.
I still have not got a hnadle on trading (losing money!) and would like to see something that works for me.
AlanM
Alan,
Thank you for your feedback. I think you probably already know the positions we have on in the Perfect Portfolio. It's quite easy just to track them on a week to week basis. This portfolio has been designed for the longer-term conservative investor.
We will be doing some updates but not on a daily basis as this is not what we do. We provide you with the tools and the concepts that are proven in the marketplace, the rest is up to you.
All the best,
Adam
Charles,
I just finished a video on CRB. The GDX also looks interesting but I prefer GLD as it is more of a pure play on gold.
Here is the link to the CRB video.
http://broadcast.ino.com/education/five_etfs_1029/
All the best,
Adam
I notice that two other ETF components that would bear watching would include GDX (miners) and CRB (commodities basket). Comments?
Shuaib,
Thanks for your feedback.
Yes, there is a certain amount of correlation and coupling between the four ETFs. However, we are seeing some of these markets begin to decouple.
As long a the markets move and that is the key, the Perfect Portfolio should do well.
All the best,
Adam
Adam, thanks for posting great videos. They help quite a bit in reaching trading decisions.
I do have a comment regarding the Perfect Portfolio. It seems to me that all 4 of the ETFs are highly (though inversely and not equally) correlated to US dollar. Although they provide diversification in the sense that individually they are equity index, commodity, precious metal and currency but all 4 of them get affected when dollar moves one way or the other. Wouldn't it be more beneficial to add an asset that is not highly correlated to US dollar, that is, if there is one?
Doesn't epp or ilf deserve to be in the perfect portfolio?
Lynn
Loic de Cupper,
Great question. We are publishing our Q3 results tomorrow at 1:30 am EST.
All the best to you.
Adam
Bonjour Adam,
Quick comment. Earlier this year, you were giving the quarterly performance of different commmodities such crude oil, soybean, wheat, gold, corn and the dollar index.
Have you stopped following those markets based on the triangles?
If no, I suppose that you will let us know about performance.
Of yes, well, it would great if you keep on tracking it as it is a nice benchmark to use and see how markets that we might not be trading are performing.
Keep up the great job with M.C.
A bientot,
Loic de Cupper
I don't understand what this has to do with the triangles of the Perfect Portfolio. This is just tracking what these ETFs did over the mointh, right? I thought the tringles told us when to buy and sell. Did the portfolio buy or sell any of the ETFs over the month?
I'm st5ill trying to figure out how the triangles work so I can sign on and get involved.
Thankls.
Donn,
we appreciate your feedback.
I'm not sure if you watch the perfect portfolio video but the concept is pretty simple is that we believe that these markets will offer great returns in the future.
The Trade Triangle technology is designed to get you into a market and to stay in that market until a change in trend occurs. In the case of the Perfect Portfolio you might be staying in a market that is trending for months and months.
You only exit and reverse this position when a new Trade Triangl comes up. This follows the old trading adage, "let your profits run and cut your losses short".
If you have any other questions that we can help you with, please give our tech support team a call at 1-800-538-7424. If you're out of the US call 410-867-2100.
All the best,
Adam
Donn, What I see in the "hypothetical" perfect portfolio is a record of what would have happened if you had already been in each of the four positions on 30Sep09 and where that position would be eactly one month latter. This is done for a matter of comparison and not as a recommendation of when to buy and sell. The line directly below each ETF shows how the actual comomodity performed. This shows you that for this time period the ETF's followed the performance of the underlying comodity very closely.
You are correct in that it would be highly unlikely that the triangles would have indicated entry points for each of these ETF's on the same day. In other words the chart above is not indicating when to enter these positions it is just showing how the ETF's match the actual comodity performance over this given time period.
At least that is my opinion.
Sunco,
Thanks for helping out.
Adam
I have a question, Adam. I am not a member but I am curious about how the Monthly Trade Triangles work. In your video link at the bottom of this post you click the 'M' and the symbols as you explain each sector and a certain number of symbols appear. I understand that. But I thought I read in the FAQ section that a symbol will appear EVERY month. That's why it's called "Monthly" Trade Triangles right? So which is it? Do the monthly trade triangles only appear on the months when a move is recommended or every month? Confused there.
Thanks!
JChief,
Thank you for your feedback.
The monthly trade triangles will only show up on the chart when there is a change in direction according to the algorithm we use. You will not see monthly Trade Triangles every month for a particular market. Monthly Trade Triangles are important because they are taking into consideration a longer time frame.
Love to have you sign up, but if you feel uncomfortable with this explanation please give us a call at 1-800-538-7424 and will have Jeremy who is our top customer support expert walk you through it.
All the best,
Adam
JChief, Monthly triangles are not monthly! I had the same confusion. It helped me to understand that the "monthly" designation is not a description of the period of time for the triangle appearance. The triangles do NOT appear at the frequency of their "descriptive name". ie the daily trangles do not appear daily and the weekly triangles do not appear weekly. As Adam explains each of them appear when the stock price moves (changes direction) in a particular fashion to meet the formulas that they have setup (algorithm). The triangles do appear relative to their descriptive name. ie You will have any number of daily triangles between each weekly triangle and you will get any number of weekly triangles between each monthly triangle. I hope this doesn't make it more confusing. You should sign up you will learn more here about being a successful trader than anywhere else. Adam's prolific videos are clear, short, appropriate and frequent.