
There's a war going on right now and I don't mean overseas, I mean right here in the markets. Last week was a perfect example as the intraday swings of the S&P500 clocked in at a staggering 6.5%. Market volatility often is a precursor of things to come, and the irony of all this action was that the market closed with a loss of -0.65% for the week.
The net weekly change for the DOW was -0.53% and there was an even smaller loss of -0.42% for the NASDAQ. All three indices formed an important Japanese candlestick pattern, a weekly doji candle. Why is this important? A doji candlestick often signals indecision in the market. When the doji forms in an uptrend or downtrend, this is normally seen as significant, as it is a signal that the buyers are losing conviction when formed in an uptrend and a signal that sellers are losing conviction if seen in a downtrend.
What To Watch For This Week
A lower weekly close would indicate to me that the buyers are beginning lose control of this aging bull market. Here is the "line in the sand" for each of the indices that I am watching. Once below this line, watch for heavy liquidation to come in across the board.
DOW: 17.262
S&P500: 1,992
NASDAQ: 4.090
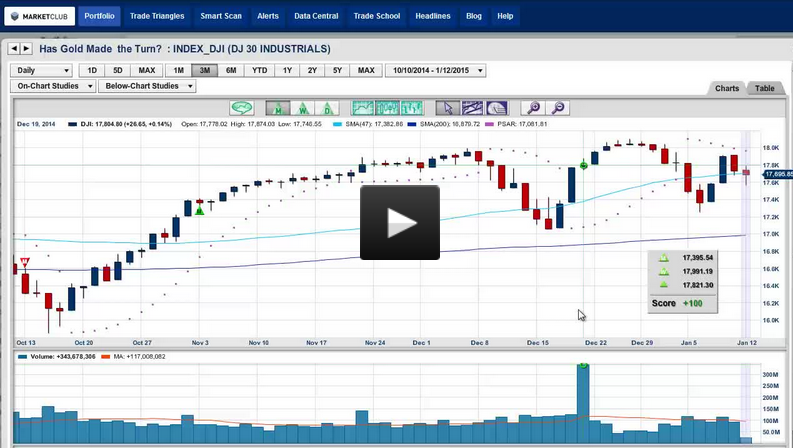
Gold Is Now Officially On The Move
You might remember on January 7th, I wrote a post on gold (FOREX:XAUUSDO) and the key neckline level. The key neckline in gold was broken to the upside last Friday when gold closed out the week with a very positive 2.9% gain. I now have a confirmed upside target zone of $1,340, which equates to about $132-$134 on the ETF, GLD. To follow all of the entry and exit points for gold, check in daily with the World Cup Portfolio.
How High Can The Dollar Go?
The U.S. Dollar Index (NYBOT:DX) continues to push higher against most currencies with another weekly gain of 0.85% in the Dollar Index. The question on everyone's mind is, how high can the dollar go without a correction? To this observer, it appears that there are technical storm clouds gathering that could spell trouble for the dollar. Take a look at the RSI indicator and check out the negative divergence that is building on the weekly charts. If you are long the dollar, you might want to review and tighten your stops.
How Low Can Crude Oil Go
That's a question better asked to Saudi Arabia as they continues to keep their oil spigots open to the world. Here is my analysis, the trend is down and picking bottoms or tops in markets is not a high percentage game. Before crude oil (NYMEX:CL.H15.E) changes trend, it needs to begin to base out and find a floor. I will leave picking bottoms to others. Meanwhile, the trend is your friend.
Have a Different View?
I invite your comments, pro or con, below this post. As always, I appreciate your feedback.
Every success with MarketClub,
Adam Hewison
President, INO.com
Co-Creator, MarketClub
Dow is in pressure to get any fresh higher levels, in fact, last bounce taken place at very wrong time frame, so now it will be a near Resistance, and more confirm signals will be based on 14th and 15th JAN's data, and that data will play a significant role for either sided break-outs.
Chart of Crude indicates that Market has some remarkable hurry to touch or achieve it's Lower Levels, As soon as possible, in a quite faster pace. Now Major support find at the range of, or near about $ 38 to $ 41, after achieving such lower marks, we may found either very very sharp recovery, or alternatively some flat horizontal move, both such probabilities, but i am not sure about any particular one, out of both.
Finally, For Gold short term Trend may have changed so far, however, it seems to get some more confirm signal for medium and long term perspectives.
and i would like to add like now a days, just "Trend is not friend", but only "short term trend is friend", so no meaning to forecast on the basis of medium or long term views.