

We have experienced an interesting time recently; almost every commodity is volatile and that provides excellent trading opportunities. Last month I refreshed the copper chart to show the miscorrelation of the two assets and, this time, we can see positive changes in the correlation.
Chart 1. Copper-Crude Oil Correlation: Distant But Synced
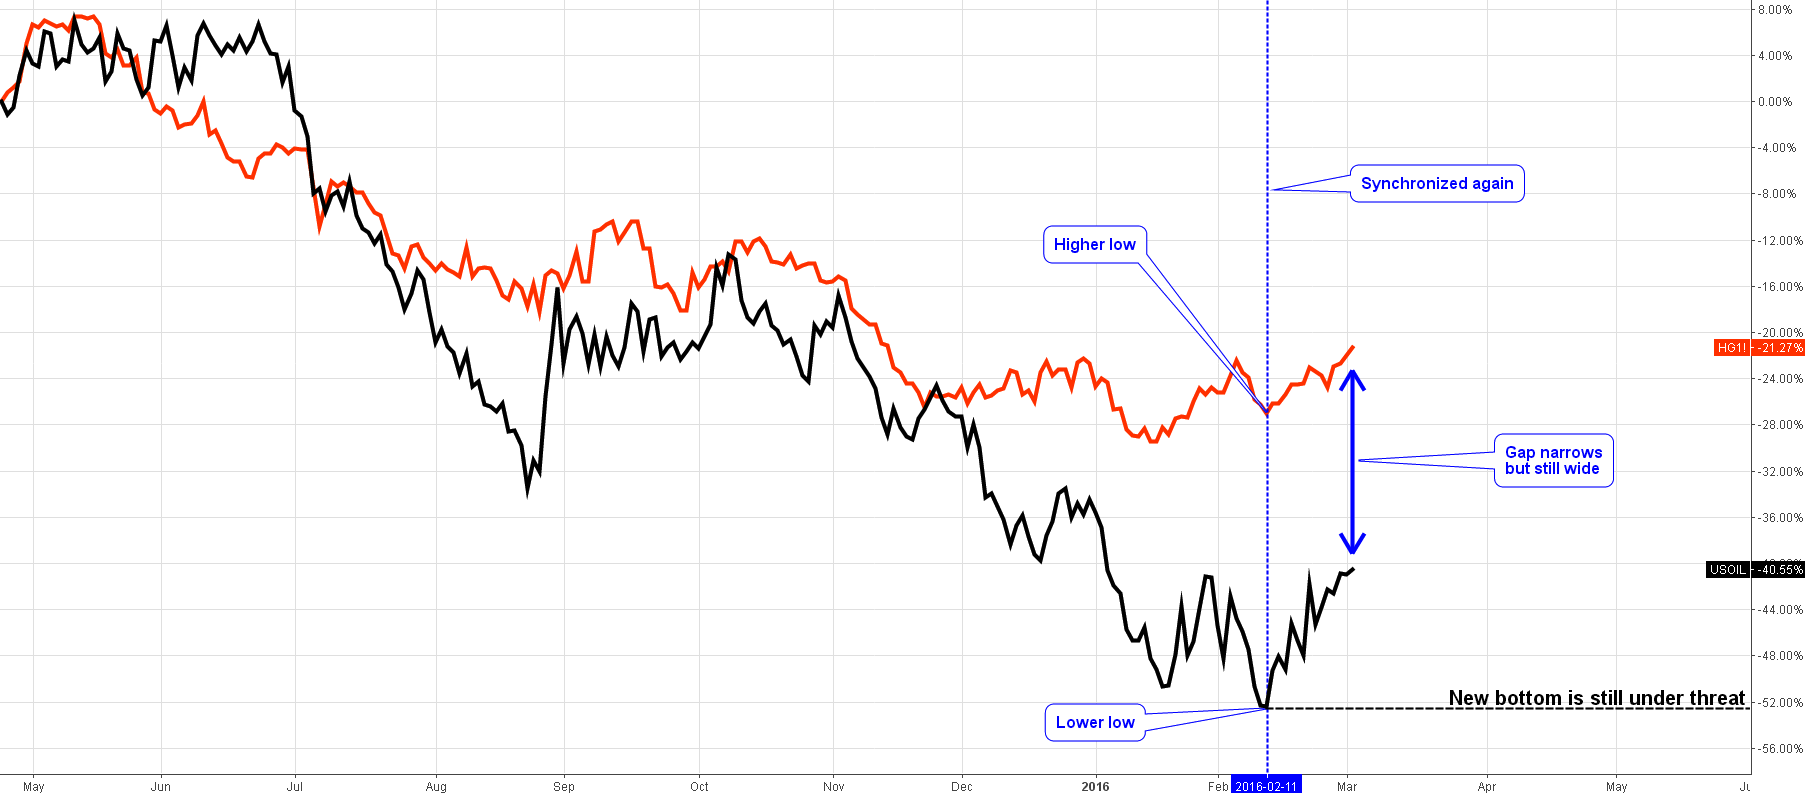
Chart courtesy of tradingview.com
As you can see in the chart above, both commodities reversed to the upside on the 11th of February (highlighted with the blue dashed vertical line). Copper managed to shape a higher low and crude oil hit the previous low level, making a new multi-year low, I doubt that we have seen the bottom yet.
Oil won back some disparity, but the gap is still broad and the overall move is flimsy with many zigzags on the graph line. Usually, “black gold” catches up with copper in a few large throws. Copper was less lucky and advanced only 6% compared to the 11% gain of crude.
This time, the correlation chart shows that oil is back on track and trying to reach the strengthening metal. But one thing is for sure, more oil weakness will seriously harm copper’s recovery.
In my earlier update I used monthly charts for the broad view, today I want to add two daily charts for each commodity to show you what is going on with the current trends. Another reason is to refresh the technical patterns in your mind for better trading.
Chart 2. Crude Oil Daily: At The Crossroads
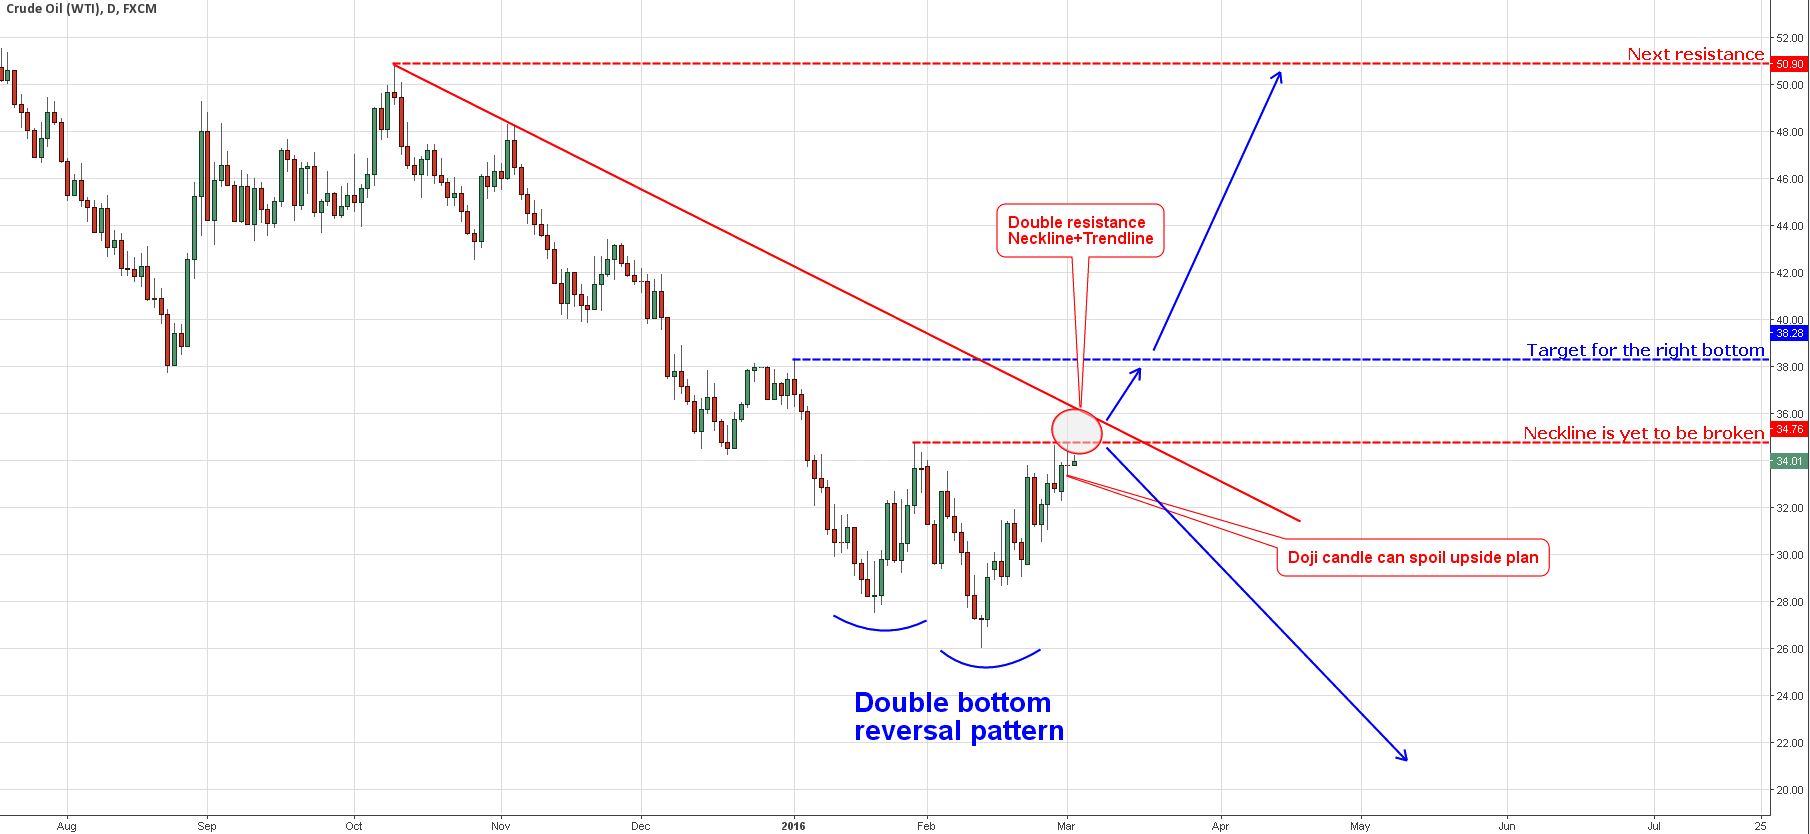
Chart courtesy of tradingview.com
There is a “Double Bottom” reversal pattern (highlighted in the two blue semicircles) detected on the daily chart above. We reached a critical level at the $34.80 mark; it is a previous high level acting as the neckline of the double bottom pattern. If the price should break and close above the neckline, expect it to continue to the target at the $38.3 area (the top of the left bottom). And the price will face another obstacle here as the red trendline falls right above the neckline. It could be hard for oil to clear away from this double resistance.
On Tuesday, the price was rejected from the neckline shaping a famous “Doji” candle. As I said before, this candle is powerful only when it gets the confirmation by following candles, they should change the color from bullish green to bearish red. So, it is still early to rely on this candle.
Above $36.20 we will see a further appreciation of crude with the first target at the $38.30 level and the most optimistic target at the October 2015 high of $50.90. If the “Doji” plays high, then we will see a quick drop back, at least to the recent bottom at the $26 level and this can spoil copper’s recent performance.
Chart 3. Copper Daily: Upside Is In The Cards

Chart courtesy of tradingview.com
I put this daily copper chart above to supplement my previous post’s monthly chart to show the hidden undercurrent.
We haven’t seen this reversal pattern for a long time in our charts. I highlighted in the three blue semicircles two shoulders and one head of Inverse Head And Shoulders pattern. It is quite a powerful pattern, especially if the neckline is broken like the copper chart above.
To find the target for this pattern, we should add the height of the head (blue dashed arrow) to the neckline point. Our target for copper is located at the $2.34 level. After that level, the next resistance is at the October 2015 high of $2.44.
This daily chart shows the details of reversal that I highlighted on the monthly chart in just a single candle. The target for the pattern is contained within both the global range of the $1.9/3.0 margins and the major trend upside at the $2.5-2.6 level.
Intelligent trades!
Aibek Burabayev
INO.com Contributor, Metals
Disclosure: This contributor has no positions in any stocks mentioned in this article. This article is the opinion of the contributor themselves. The above is a matter of opinion provided for general information purposes only and is not intended as investment advice. This contributor is not receiving compensation (other than from INO.com) for their opinion.
Thanks for this great post...
Dear Aimee,
You are welcome, thank you for feedback!
Best wishes,
Aibek
Be careful. We still are at 370% total debt to our GDP. And let's see what China's numbers look like when reported. Their copper consumption may continue to decline. A worldwide deflationary trend will continue to contract demand for commodities. How much longer can the copper rally last? Japan, Europe, U.S. and China all have excessive debt risk.
Dear Dick,
Thank you for care and thoughts that you share. Indeed, globally nothing has changed and I clarified in the post that this is a supplement post to the previous long term update with detailed daily charts. I agree with you that commodities are in a downtrend but copper still can reach upside of this falling trend within a deep correction.
Best wishes, Aibek