

All of the top commodities have rebounded amid the dollar's weakness recently, but copper didn't follow the pack to make gains. I think we should take a chance as this misbehavior will not last for long.
Chart 1. Copper-Oil Correlation: Huge Divergence!
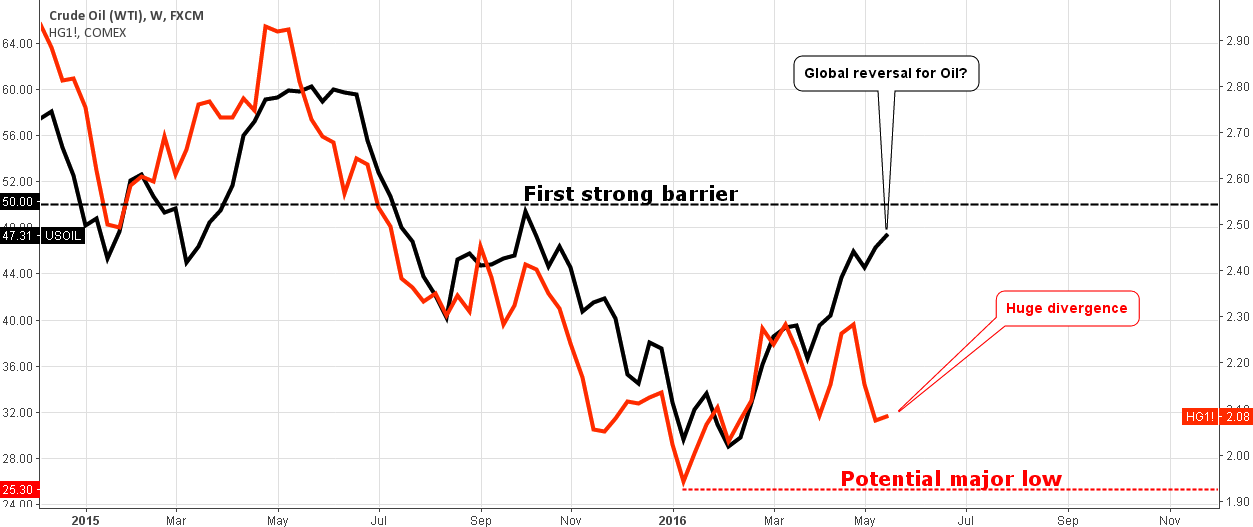
Chart courtesy of tradingview.com
The crude oil is very strong these days, although last time we have been witnessing its comparative weakness to copper. It looks like the Double Bottom reversal pattern is still making the game for oil with the first strong barrier at the $50 level.
This time, copper overreacted to the short-lived drop of crude hitting the $2.06 area, and this gap that we can see on the chart above kept at the following strong rebound. And then another weird thing happened – crude oil had a minor pullback and continued its upward move while copper overreacted again down to the previous low area at $2.06, this time with even larger divergence. Now look at the left part of the chart, the current gap reminds me the one-year-old situation – oil had stalled at the end of May 2015 while copper overcame it with a new high and then it dropped sharply to run down crude. Therefore, there is a high probability of copper catching up soon with the current oil price corresponding to $2.40-2.50 copper price levels.
Let's look at the copper chart below to find it out.
Chart 2. Copper Daily: Risk/Reward Favors Long Setup

Chart courtesy of tradingview.com
In a previous copper update I assumed that the copper will fall out of the daily uptrend and will follow the weakening crude oil. Indeed, the metal dropped right the same day when the update was posted and soon reached quite a deep low at $2.06 level (18 cents gain), but failed to progress to the previous major low at $1.93 projected as a minimum target amid rising crude.
I would ask you to read my earlier post with a copper update to refresh your memory of how the current major bottom was shaped. It looks like the title of the post was prescient (Metal Signals Short Term Bottom For Oil) as well as the title of the next post which wondered if we had bottomed then.
If we admit that we already have bottomed, then the upside move from $1.93 level started this January is the first medium-term bullish action marked as the blue AB segment. Then the next zigzag down from the $2.32 area is the first medium-term pullback which has hit a very important and most common 61.8% Fibonacci retracement level below $2.08.
The Friday candle shaped the reversal Doji candle (open $2.076 close $2.074) with an almost absent body. Today’s candle is still in progress, but it already reached the high of the Friday candle.
If we assume that the CD segment started on Friday, and it is equal in length to the AB segment, then the target is located on the $2.4375 level – right at the area of the last October top. And it confirms the corresponding copper level of current oil price described below the Chart 1. So many coincidences bring more confidence that we should see a strong upside move in copper. The maximum risk should be set below the major low located at the $1.93 level, and the risk/reward then will be healthy.
Intelligent trades!
Aibek Burabayev
INO.com Contributor, Metals
Disclosure: This contributor has no positions in any stocks mentioned in this article. This article is the opinion of the contributor themselves. The above is a matter of opinion provided for general information purposes only and is not intended as investment advice. This contributor is not receiving compensation (other than from INO.com) for their opinion.
I forgot to write one important point, as per my study, current Oil rally will last maximum up-to second or third week, and there after, Oil will turn bearish again, with a lower targets of $ 42 $ 35 and may be touch lower marks up to "Sub $ 30 " range again.
Dear Rasesh, always a pleasure to read your valuable comments!
Below is the link to the quarterly chart of Oil.
https://beeimg.com/images/l57140659291.png
I agree that it is still early like in Gold to judge if this move is a new bull run. It will confirmed by the break above the previous long term high.
Look at the chart at the link above. We can see:
1) Break of the quarterly downtrend. There is no enough points to build uptrend yet but this is just the beginning.
2) Last quarter shaped reversal Dragonfly Doji candle
3) The reversal was confirmed by the record volume (subchart below)
4) We can benefit from the upmove like in top metals not waiting till the break of previous high.
Best wishes, Aibek
Dear Aibek,
Thanks for providing me some interesting as well important chart and your study thereon. I will surely try to study your views, however, still i prefer to wait for some fresh, and not up to previous high, but at list near break out.
If We compare or predict Bull face in any other commodities with a view to or on the basis of currant gain in Oil, results thereof may differ because on the ground of Technical View, such base, i.e. Oil it self just cant consider so strong. Oil is just delivering some technical bounce back, and any trend reversal yet not confirm, so if Oil may touch 55 or even up to 62, then too, that will be not treated as a trend change, unless oil sustain above levels and cross / close above that levels on weekly basis.
Finally, i am just considering Medium or Long term perspectives, so my above opinion must be treated accordingly only.
Seems like oil is not really as affected as it seems as wars are raged in middle east. There are a lot of sources to take aside from those countries. It's just nice to know that it is now kicking back.
Thanks for this post by the way. Loving it.
Dear Alaister, thank you for reading!
Yes quite often market bottoms when majority calls for new low.
Aibek, I really like what you write !!
Please answer my questions about BITCOIN and write a new article.
Thank you with l.o.l.
Dear Ernie,
Thank you for feedback, I just analyzed the dynamics of Bitcoin and I am not an expert for cryptocurrencies though can't help you with the technical details of trading including exchanges and brokers.
If you have such an expertise, please share with us, I would be greatful to you!
Thanks for your email.
Question.... is FCX a stock who is holding copper?
Thanks.
Dear Geurt,
According to open source information on the web the FCX has copper mines in its portfolio.
Why does COPPER prices stick so close to OIL prices ?
Dear Al, these commodities move together as both demonstrate the health of economics - energy and material for construction and communication.