

History repeats again and again as human beings don’t change; they only change on the surface. There is a good lesson learned from the Gold Rush in the 19th century – there were some lucky diggers, who made a fortune, at the same time many merchants who were selling equipment and jeans became rich. But many adventurers left broke.
These days we have the Crypto-Mining Gold Rush led by Bitcoin with a market share of more than 60% and market capitalization over $124 billion. This coin is worth as much as the Hungarian GDP and exceeded the market cap of NVIDIA Corporation (NASDAQ:NVDA) – one of those “merchants” selling “shovels” to modern “diggers” aka miners.
Today, as long ago, the competition gives an advantage to cooperated mining pools with the most advanced equipment, lowest electricity, and labor costs. That’s why there is no surprise that the top mining pools are located in China (70% of the Bitcoin hashrate).
There are two main types of suppliers to the crypto mining industry: electricity suppliers (up to 70% of all mining costs) and equipment suppliers. The massive demand for mining equipment attracts nimble middlemen, for instance, they resell the ASICs (application-specific integrated circuits, microchips) for 2x-3x of the original price tag, making relatively risk-free money on modern “diggers” that risk a lot.
Cryptocoins could be mined on ASICs, GPUs (graphics processing units, video chips) and CPUs (central processing units).
The top ASICs producer is Bitmain Technologies LTD, located in China. This private company runs the largest mining pool in the world called AntPool, as well as one of the largest cloud mining operations, subsidiary Hashnest. Bitmain is worth billions of dollars (from management words), the company could go for an IPO soon as it was warmly admitted by investors (Sequoia and IDG already invested $50 million, McAfee’s MGT Capital Investments signed a letter of intent to form a joint venture in the USA). So watch it closely as this company generates around $250 000 per day on its mining pool.
GPU (video chip) makers are well known from long ago. And you can trade their stocks as they are public companies. There are two rivals – the industry leader NVIDIA Corporation (NASDAQ:NVDA) and Advanced Micro Devices, Inc (NASDAQ:AMD). I would like to add a prominent chip maker to the pack. The Taiwan Semiconductor Manufacturing Company, Limited (NYSE:TSM) also known as Taiwan Semiconductor is the world's largest dedicated independent semiconductor foundry. I would like to focus on them today to share some technical insight with you.
Let’s see how these stocks did in 2017 compared to the S&P 500 index.
Chart 1. NVDA, AMD, TSM Vs. S&P 500 (YTD)
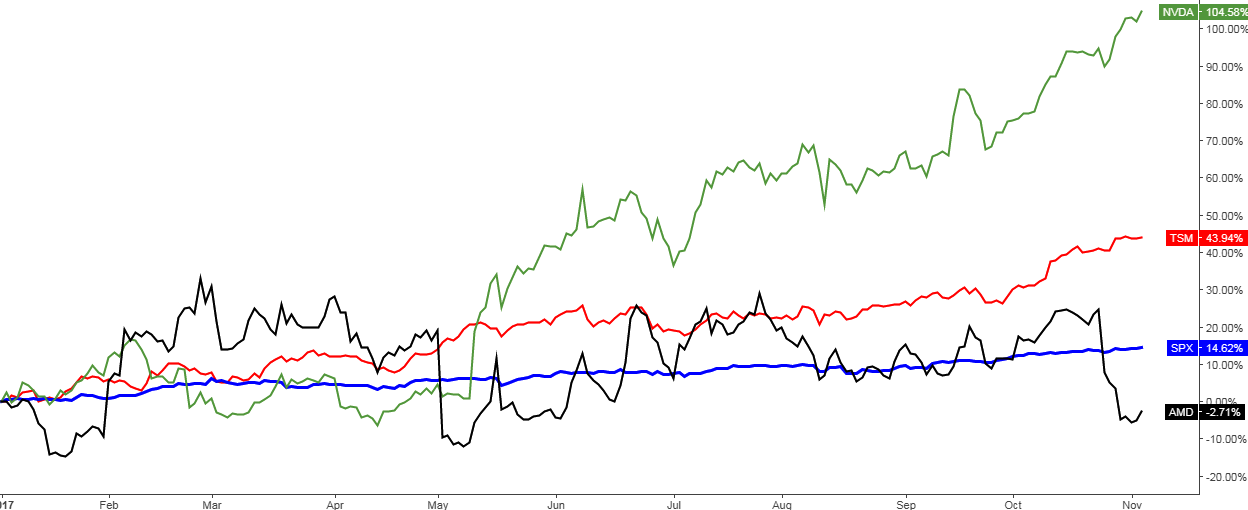
Chart courtesy of tradingview.com
I chose the year-to-date period as this year has been fruitful for Bitcoin as it broke above the 2013 high ($1163) in April. Also, just this year have Wall Street, Silicon Valley, CME and prominent investors started to look at Bitcoin seriously after it survived all the doom’s day forecasts.
NVIDIA Corporation (NASDAQ:NVDA): (green) has doubled its price year-to-date, and it is the best result of this competition. It is not a surprise as the company produces the best and the most power efficient video chips for mining (Nvidia GTX 1070). The trend for NVDA looks like the chart of the Bitcoin, which is trying to reach for the sky. Of course, here is the different percentage scale, dozens vs. hundreds in Bitcoin chart.
Taiwan Semiconductor Manufacturing Company Limited (NYSE:TSM): (red) is second with a +44% gain, S&P 500 index (blue) is ranked the third with a +15% gain. These two instruments have gentle trend lines slightly sloping to the upside.
Advanced Micro Devices (NASDAQ:AMD): (black) is the only name in the red with -3% loss this year. The loss appeared in the last week of October when the price plunged 20% from +25% down to -5% for this year despite the news about the first profit since 2014. Investors disliked that AMD didn’t raise its sales and profit forecasts for the 4Q 2017. Besides that, the Morgan Stanley provided negative forecasts for crypto-mining demand for video cards. It is a matter of time to prove it or bust it. Bitmain sees $100, 000 price tag for 1 Bitcoin over the next five years.
I would like to make a separate chart analysis of AMD for you as this stock could be of buying interest amid weakness.
Chart 2. AMD Weekly: Consolidation
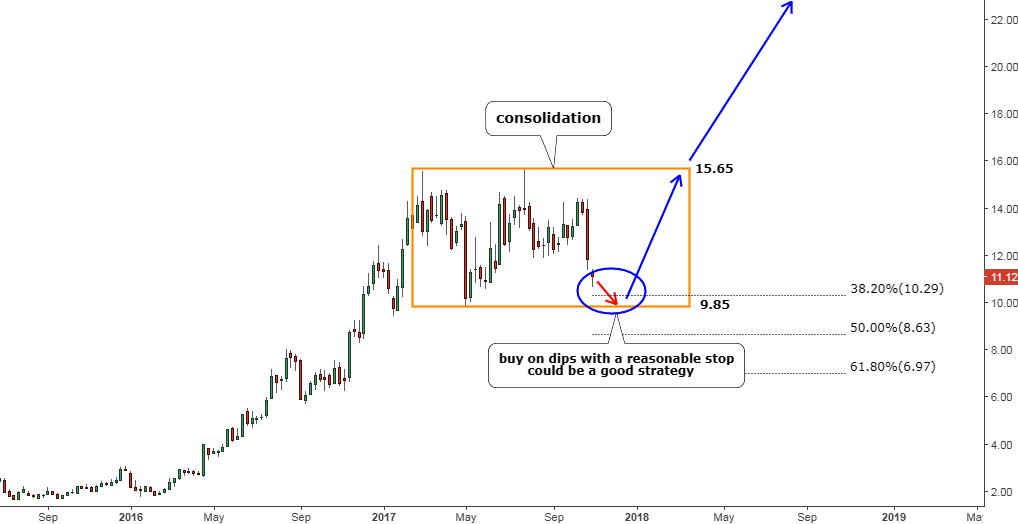
Chart courtesy of tradingview.com
In the chart above, you can see why 2017 is not the best performing year for AMD. The price is caught in a significant range consolidation (orange rectangle) after a tremendous gain in 2016. It’s natural market behavior.
Long before that, if we would squeeze the chart and scroll it to the left to 2000 then we could see a post-dot-com era bubble burst when AMD collapsed from $48.5 in 2000 to the $5 low in 2002. Then another rocket-style rise till the peak at $42.7 in 2006 followed by the long-running drop and fading to the $1.61 low in 2015. Just imagine – 9 years of falling prices. And now we are witnessing rags to riches story with AMD.
I think the best strategy here is the buy on the dips. Don’t forget to set a reasonable stop to avoid excessive risks. The price almost reached the 38.2% Fibonacci retracement level at the $10.29. The next support will be at the rectangle’s downside (previous low area) at $9.85. Further supports are located at the 50% ($8.63) and 61.8% ($6.97) Fibonacci retracement levels.
Before the consolidation phase, the price grew a hefty $14, and this amazing trip could be repeated after the price will break out higher. If the current weakness stops around the $9 mark, then the target could be hit at the $23 level (9+14), which is more than double the rise in the price.
Below are the fundamentals of the three above mentioned stocks for comparison.
Table 3. Fundamentals
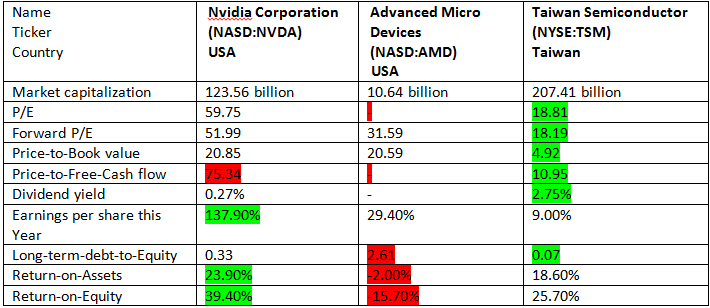
Chart courtesy of finviz.com
Intelligent trades!
Aibek Burabayev
INO.com Contributor, Metals
Disclosure: This contributor has no positions in any stocks mentioned in this article. This article is the opinion of the contributor themselves. The above is a matter of opinion provided for general information purposes only and is not intended as investment advice. This contributor is not receiving compensation (other than from INO.com) for their opinion.