
Two main factors are driving the rally in the US stock markets recently; retail traders buying the dip, and Q3:2021 earnings data is starting to shake away the concerns that resulted in the recent market rotation. Combine these activities with the start of the Christmas Rally phase (which usually starts sometime after mid/late-October and carries through into early January), and we have the making of a moderately strong potential price rally in the US major indexes over the next 60+ days.
The $4550 Level Is Critical Resistance For The S&P 500
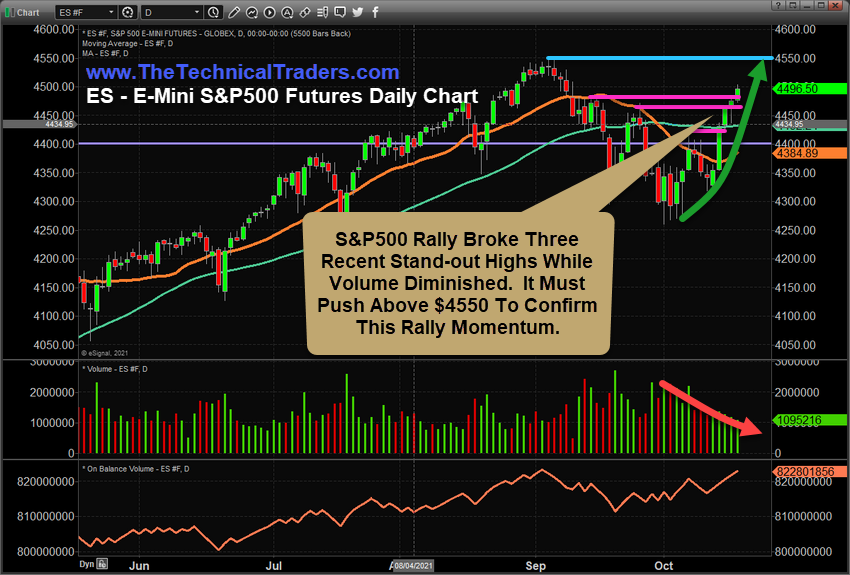
I’m highlighting this ES Daily and Weekly chart pattern, below, to share with you how important it is to see the ES break above the $4550 level – the past high price peak. If the markets are going to start a new rally headed into the 2021 Christmas season, then we need to see the ES continue to rally and break above the $4550 level. It is critically important that price breach the $4550 level and attempt a strong move higher if this bullish momentum persists.
The ES has already broken above three previous Stand-out Highs, drawn in MAGENTA. This shows the strength of a bullish price advance and building bullish price momentum. Yet, the final price high, near $4550, is critically important from a technical standpoint.
If the price fails to breach above the $4550 level, a Double-Top, or Right-Shoulder type of price pattern will be set. This could indicate a failure in price momentum and may suggest the price will continue to consolidate further. A more confident rally above the $4550 level will indicate buying momentum is not concerned with this previous price peak level.
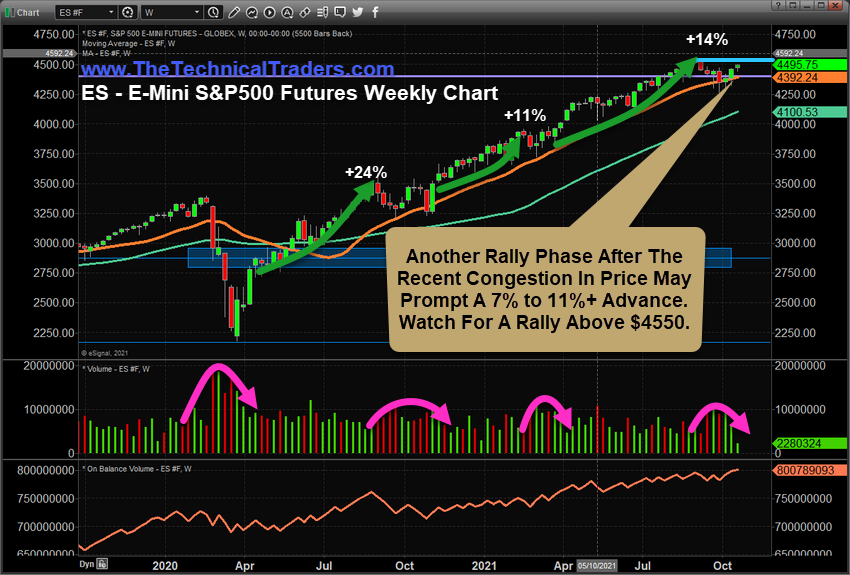
S&P 500 May Rally 7% To 11% Or More After Breaking Above $4550
This Weekly ES (S&P500) Chart highlights the multiple periods of price congestion which also prompted large volume spikes as traders moved capital away from perceived risks. After the price consolidation ended, traders pushed prices higher while volume stayed moderately diminished overall. Each new advance in price prompted a substantial price rally.
If this same type of Price/Volume setup happens after the current deeper downside price rotation, then we may see a new rally in the ES which could target $4750~4800 – a full 11~12%+ above the recent lows near $4300.
The critical resistance level near $4550 holds the key to when and if the ES is able to advance further and push the Christmas Rally into existence or if the price will fail to breach the $4550 level and continue to consolidate and rotate for longer.
Traders should prepare for the potential of a strong breakout price rally as the price continues to attempt to move higher while watching the key $4550 resistance level. I would expect the price may possibly stall as it attempts to move closer to the $4550 level – so be prepared for some additional volatility. If price rallies through the $4550 level quickly, then we may see a very strong Christmas Rally start to set up for the US markets – possibly rallying beyond my $4750~$4800 initial targets.
You don’t have to be smart to make money in the stock market; you just need to think differently. That means: we do not equate an “up” market with a “good” market and vi versa – all markets present opportunities to make money!
We believe you can always take what the market gives you and make CONSISTENT money.
Learn more by visiting The Technical Traders!
Chris Vermeulen
Technical Traders Ltd.
Disclosure: This article is the opinion of the contributor themselves. The above is a matter of opinion provided for general information purposes only and is not intended as investment advice. This contributor is not receiving compensation for their opinion.
Hallo Chris,Is jy van die RSA?