
The Fed’s tightening puts hard pressure on the broad stock market and chip makers are not the exception. The strong labor market statistics and ongoing inflation pressure supports the hawkish mode.
If one thinks that the sell-off might be over, there is a chart below that I spotted a disastrous model for a well-known chip maker Advanced Micro Devices, Inc. (NASDAQ:AMD).
You definitely know this chart pattern I spotted for you. It is a Head & Shoulders reversal model. Last time this notorious chart pattern appeared in my posts was in May on the chart of Ethereum cryptocurrency. I updated it for you below to illustrate the historical sample.
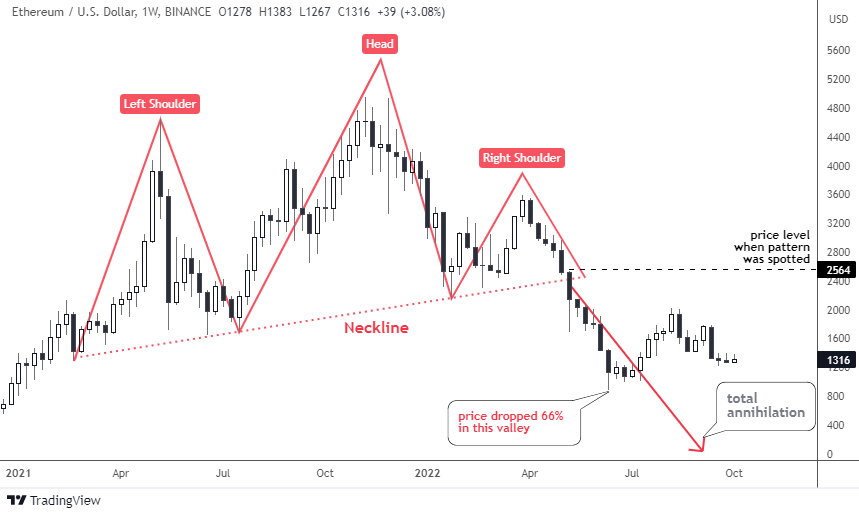
As soon as the price crossed below the Neckline beneath $2,400, Ethereum collapsed as it had lost a tremendous 66% down in the valley of $884 in June from the post level of $2,564.
This is how this model has played out before and that is what we could expect in the next chart of AMD below.
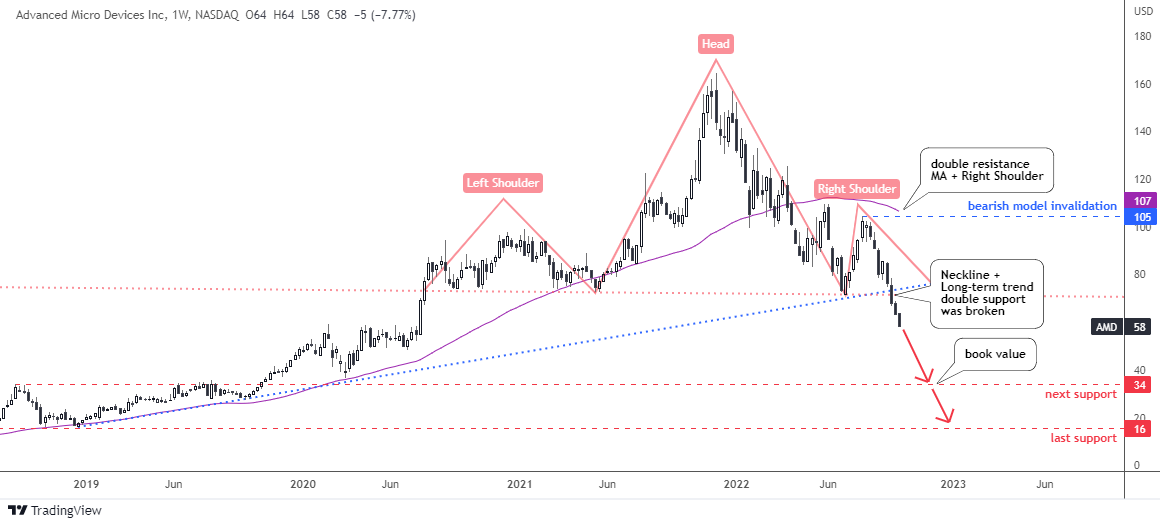
The Head & Shoulders pattern (pink) here is more balanced compared to up-sloped model in the Ethereum chart. The Neckline touch points are located almost exactly at the same level of $72, hence it is a flat line. The Head is quite tall above the wide Left Shoulder and the narrow Right Shoulder. The top of a latter offers a strong resistance and the invalidation point.
The 52-week moving average (purple) fortifies the above mentioned resistance as it is located in the same area.
The price has already crossed down the Neckline of $72 and the collapse only accelerated. The target rule requires us to subtract the height of the Head from the Neckline, this math results in a negative number of minus $21. The stock price can’t go negative; thus it means the total annihilation of AMD price as it was earlier indicated for Ethereum.
Indeed, the latter fell sharply, however, its price has still four digits not a single-digit. Instead of a doomed target, I highlighted two supports in the chart to watch.
The next support is located in the area of 2018-2019 tops and 2020-year valley at $34. Currently, this price tag corresponds to the book value of the stock. Amazing coincidence of technical and fundamental levels.
The last support in the double-digit area is located at the top of the 2017-year and valley of a 2018-year at $16.
AMD announced preliminary third quarter 2022 financial results last week. According to a press release from the company, revenue is anticipated to be $5.6 billion, which is much less than the initial prediction of $6.7 billion.
“The PC market weakened significantly in the quarter,” said AMD Chair and CEO Dr. Lisa Su. “While our product portfolio remains very strong, macroeconomic conditions drove lower than expected PC demand and a significant inventory correction across the PC supply chain.”
Intelligent trades!
Aibek Burabayev
INO.com Contributor
Disclosure: This contributor has no positions in any stocks mentioned in this article. This article is the opinion of the contributor themselves. The above is a matter of opinion provided for general information purposes only and is not intended as investment advice. This contributor is not receiving compensation (other than from INO.com) for their opinion.