
Ethereum (ETHUSDBIT) has an annihilation pattern in its chart and I would like to share it with you below as the price of the second largest crypto is approaching the trigger point.
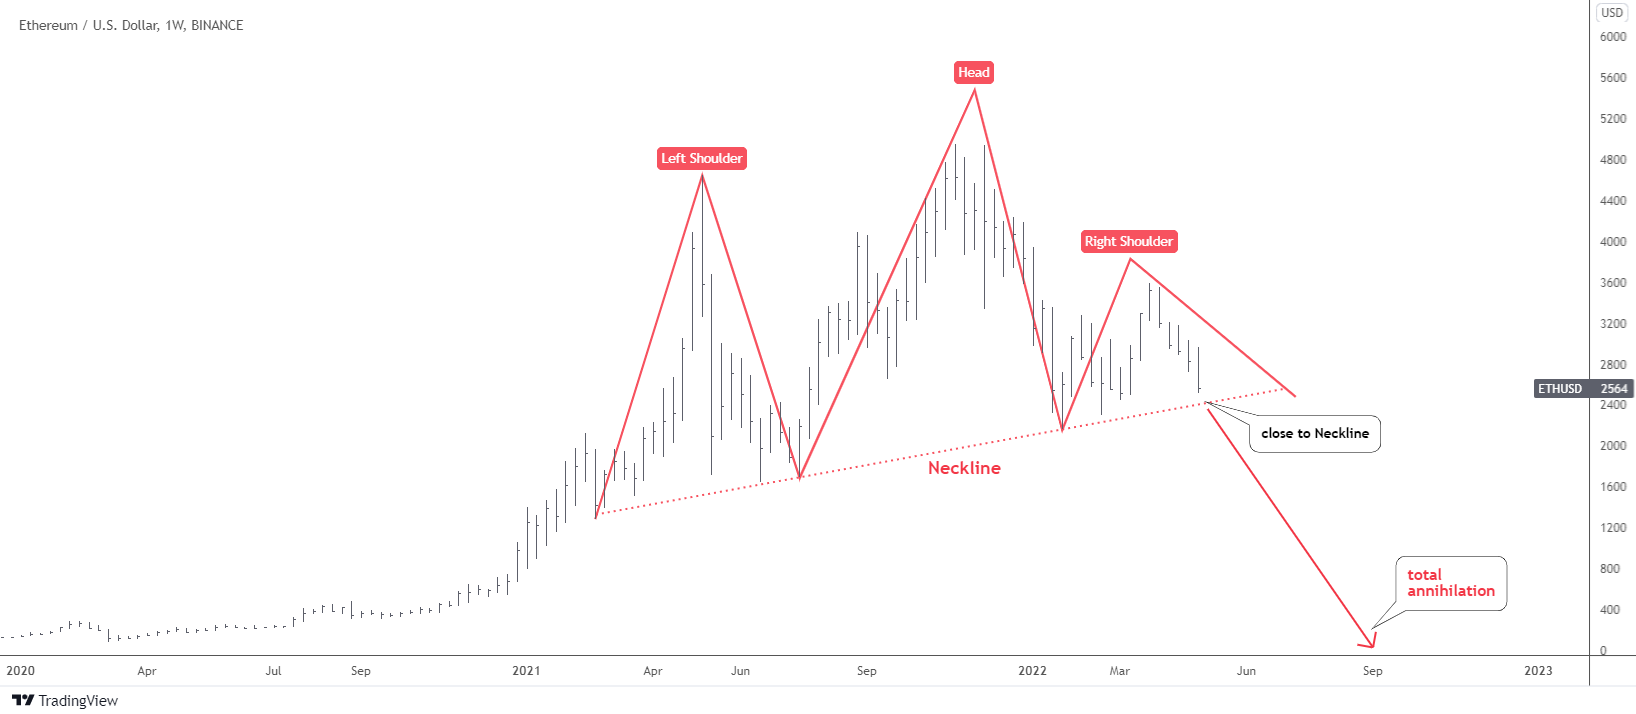
You know this famous pattern very well as this model frequently appears in different instruments. I know it looks a little bit weird as the shoulders are not symmetric. However, all parts are in place, and the Head is the highest peak.
The failure to proceed to the upside after breakout beyond this February’s peak of $3,280 dried the demand for the second largest cryptocurrency; it has been building the small Right Shoulder of the pattern. The Neckline has been drawn through the valleys of the Head.
The price is approaching the Neckline at a dangerously fast pace. The breakdown of that trigger below $2,350 would open the way to the downside. The Head is so tall above the Neckline that the target calculation is confusing. When the height of the Head is subtracted from the Neckline break point, it gives the negative aim number of around minus $600. Once, I already doubted such an outcome for the Crude Oil futures, and it dropped to negative numbers. However, this is not a futures market, and it is highly unlikely to see something below zero, which means total annihilation of the Ethereum price.
Bitcoin (BITSTAMPUSD) is up next.
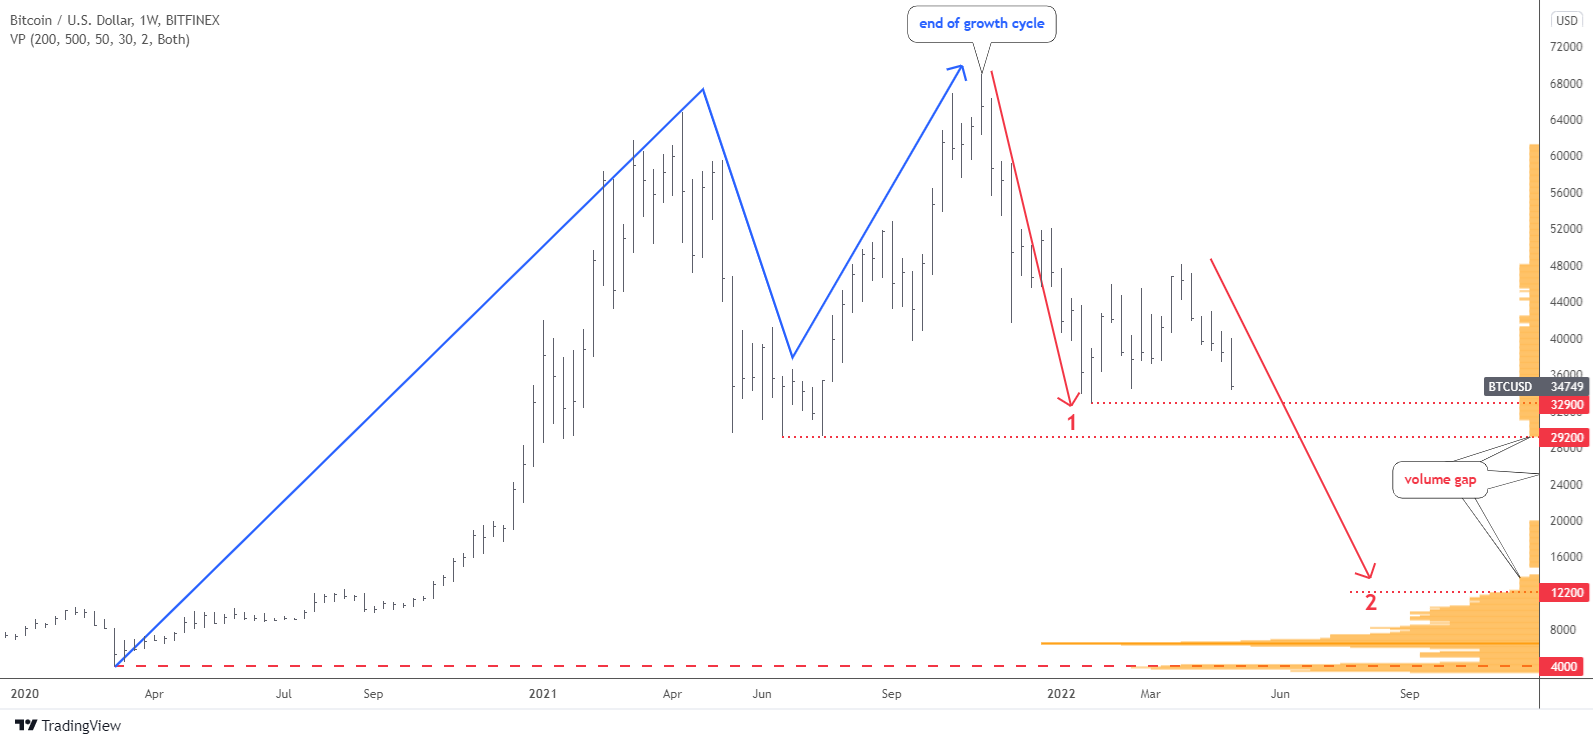
Bitcoin has failed to grasp the bullish area above the $46k and quickly reversed to the downside. The collapse is fast as the nearest support is already within arm’s reach at $32.9k. The breakdown would open the way for building the two-legged, large correction (red). In this case, we shall consider the previous growth cycle (blue zigzag) as completed at the apex established last November at $69k.
The second red leg down could push the price down to $12.2k, the price area unseen since the fall of 2020. The price could face another strong support on its way to the downside in the valley of Y2021 at $29.2k.
This is the first time I have applied the new Volume Profile indicator (orange). Volume Profile is an advanced charting study that displays trading activity over a specified time period at specified price levels. Kudos to trading enthusiasts who created this good instrument for other users.
The indicator confirms a volume gap right under the second support below $29.2k down to $14-12k, the target area of the red leg 2. The small volume support area is between $20k and $15k. The largest volume cluster is located between $7.5k and $6k. This area could be the “die-hard” support. The next strongest support is within $3-$4.4k. Another crucial point is the starting point of the preceding growth cycle at $4k.
Let us think about the reasons that could undermine the price of cryptos. I will list my first thoughts in the ballot below.
Please kindly share your thoughts as every voice matters.
Intelligent trades!
Aibek Burabayev
INO.com Contributor, Metals
Disclosure: This contributor has no positions in any cryptos mentioned in this article. This article is the opinion of the contributor themselves. The above is a matter of opinion provided for general information purposes only and is not intended as investment advice. This contributor is not receiving compensation (other than from INO.com) for their opinion.