
The price action in the silver futures has given a false hope to bulls this month.
The largest volume support (orange) has offered a solid support for the silver futures price lately. It is located between $17.4 and $18.2. The price has tested it three times already and failed to break it down.
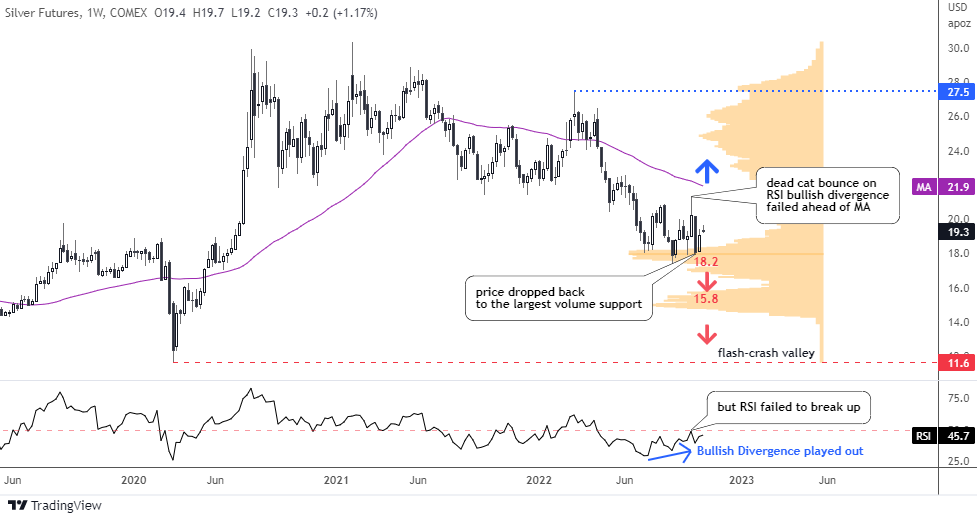
The RSI has built a Bullish Divergence during the second touchdown at the end of the summer. The reaction was an imminent reversal to the upside. It was promising price action for the bulls as the futures price soared from $17.4 up to $21.3 by the start of this month to book the gain of almost four bucks (22% growth).
Afterwards, the same indicator has failed to break above the 50 barrier in spite of a strong impulse and so did the price rally. It stopped more than half dollar below the moving average (purple).
The price dropped back to the largest volume support after above mentioned failure but bounced then. It has managed to score more than one dollar from the latest valley of $18. This puts the silver futures between the hammer ($21.9, moving average resistance) and the anvil ($18, volume support).
The chart structure of the recent rally looks corrective. This means that the weakness of the price should resume. The next support is located at the following volume area of $15.8.
There are no other significant levels to catch the “falling knife” of silver except the “Flash-Crash” valley in $11.6. The drop to the latter could build a larger corrective structure visible on a bigger map.
The invalidation of the bearish outlook would come with the breakup of the moving average above $21.9.
Last time, your most popular answer was that silver futures would stop at $16. The next bid was bullish. None of the bets have played out as yet.
Last time I updated the palladium chart in January, I highlighted two scenarios for you as the technical outlook (blue) was in contradiction with the fundamental outlook (red). I put the old chart below to refresh your memory.
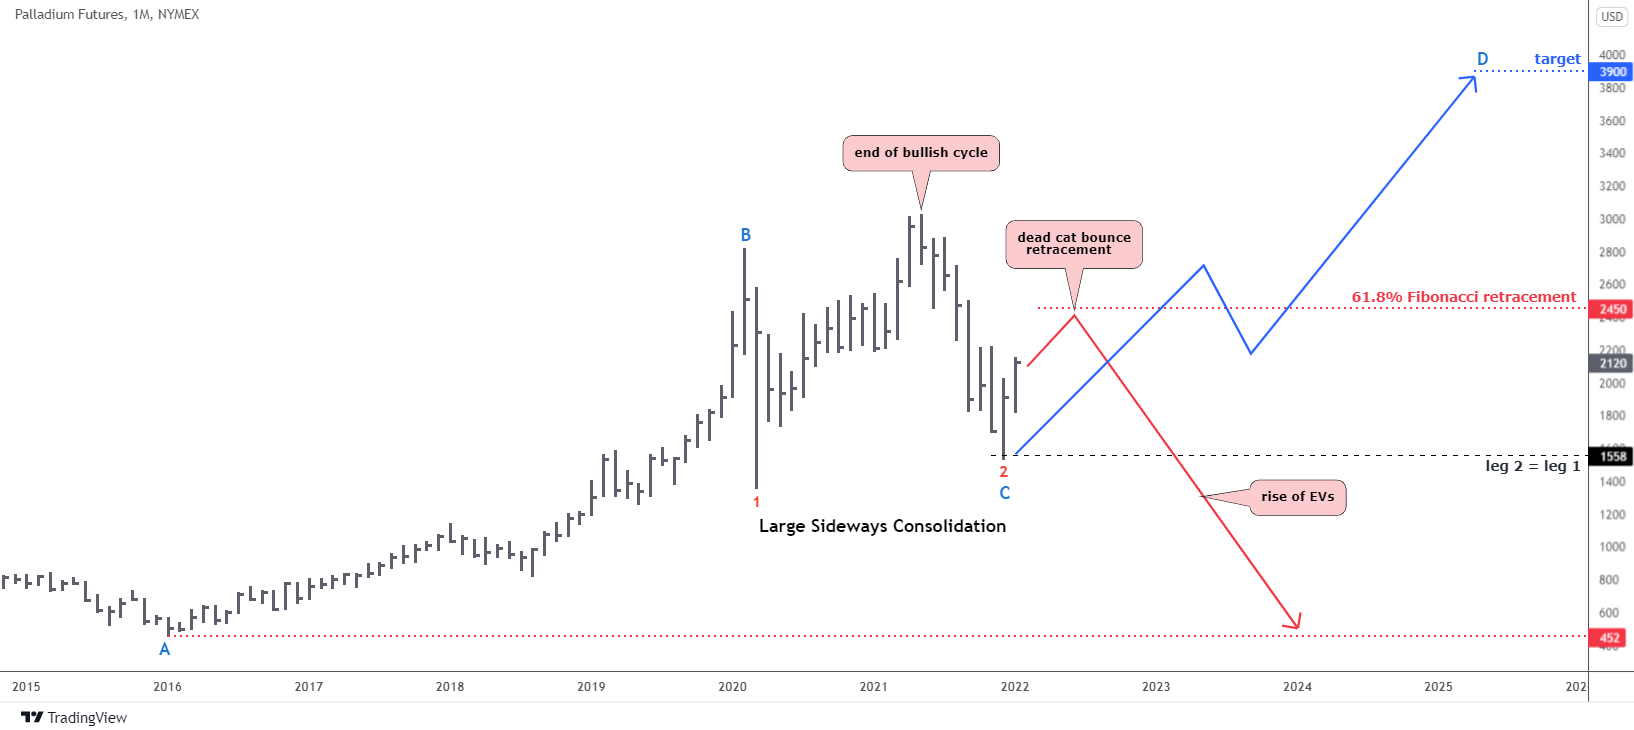
The blue scenario is about to be eliminated as the disastrous pattern I spotted for you below could reverse the technical outlook down to match with a red bearish path.
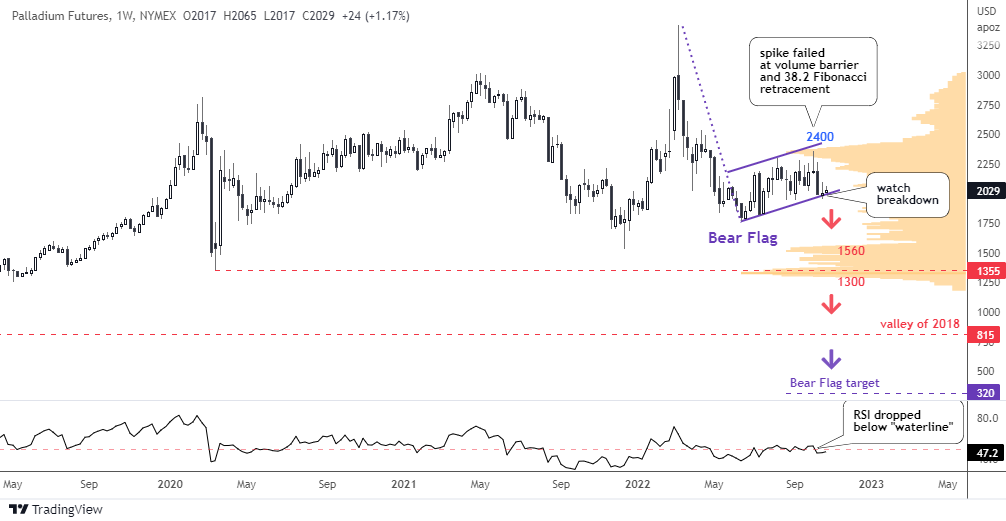
The shallow advance of the price has failed to overcome the double resistance of the volume barrier and the 38.2% Fibonacci retracement level around $2,400 at the beginning of the month.
Overall, the move to the upside from June to October resembles the sideways consolidation after a huge drop from the all-time high of $3,425. These elements have jointly built a well-known Bear Flag pattern (purple). The price is sitting right on the flag’s support. Watch the breakdown of it for a confirmation of the pattern.
The flag’s target aims at $320. To find this target, I subtracted the height of the flag pole from the flag’s support. It means a huge collapse of the price as it should lose more than 80% of its current value. Ouch!
There is the largest volume support area between $1,560 and $1,300 to be broken first. The next support is located at $815 in the valley of Y2018.
The majority of readers (65% vs. 35%) chose the bullish outlook for palladium last time.
Intelligent trades!
Aibek Burabayev
INO.com Contributor
Disclosure: This contributor has no positions in any stocks mentioned in this article. This article is the opinion of the contributor themselves. The above is a matter of opinion provided for general information purposes only and is not intended as investment advice. This contributor is not receiving compensation (other than from INO.com) for their opinion.
my view is simplistic..............the dollar is topping out here, so my opinion is Silver makes run to the MA
Dear Mr. Levy,
Thank you for sharing, long time don't see your comments. 🙂
Let's live and see.
The dollar's top could be just a short break for the Fed to reload the gun.
Take care,
Aibek
Aibek, thanks for posting your analysis. I appreciate the viewpoint. My read of silver is that the trade since the July low is a connective Elliott pattern which could rally to the area of the 50 and 100 week moving averages around 20. This could be followed by a rather tortuous trading range, stair-stepping lower for the next 6-8 months before the final low in the 12-14 area.
Dear Ms. Bussie,
Thank you for a warm feedback.
I really appreciate that you share your valuable thoughts on the Blog.
I see your map, it means more complex correction to the upside first followed by a long-lasting crawl down (not a sharp drop).
I think it’s a viable alternative.
Watch “hammer” and “anvil” 🙂
Best regards,
Aibek