Silver Update: Roller Coaster Ride

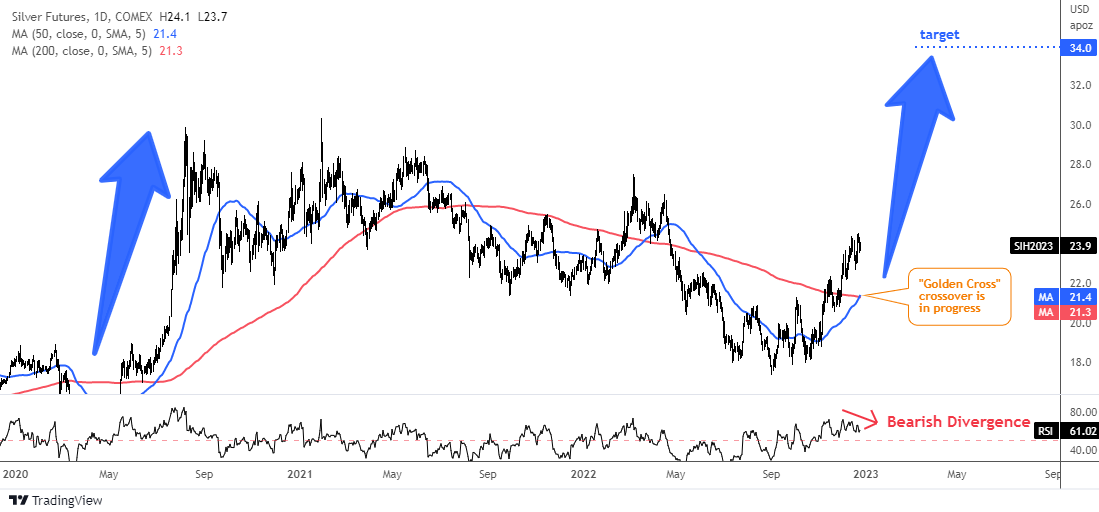
The previous post “Golden Pattern For Silver, Not Gold” from December highlighted a bullish pattern called the 'Golden Cross' that appeared on the daily chart of silver futures. This occurred when the 50-day moving average crossed over the 200-day moving average.

While the majority of readers considered this signal to be reliable, they did not expect the price of the metal to rise above $30.

The following daily chart will show how the pattern has played out since then.
Silver Futures Daily

Source: TradingView

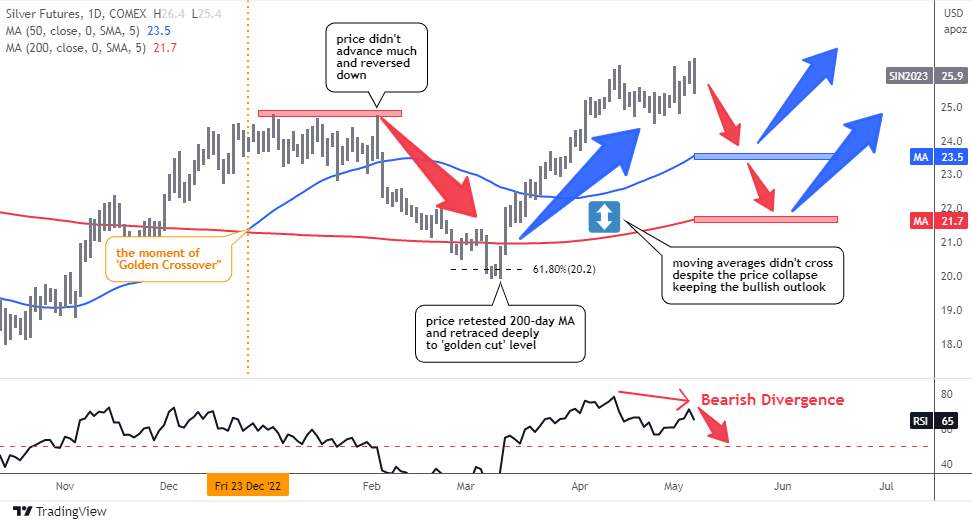
When the ‘Golden Cross’ signal was posted, the price of silver futures was at $23.9 (marked by the orange vertical line), and it went up almost $1 to reach $24.8 before stalling for over a month.

The price was unable to break above this new high and subsequently collapsed, dropping below the blue 50-day MA and testing the red line of the 200-day MA, briefly breaking through to reach the ‘golden cut’ Fibonacci retracement level of 61.8% at around $20. Continue reading "Silver Update: Roller Coaster Ride"

A New Bull Market In Gold?

We continue to think precious metals are one of the best risk vs. reward opportunities right now.

Last week, we shared the Gold to $5K Report with you from our friends over at All Star Charts.

You can check it out here, in case you missed it. The report outlines all of the reasons why Gold could hit $5,000/oz. sooner than the crowd expects.

Today we want to reiterate that it's not just Gold that looks attractive here. Silver is also poised to move higher.

Gold and Silver Futures Chart

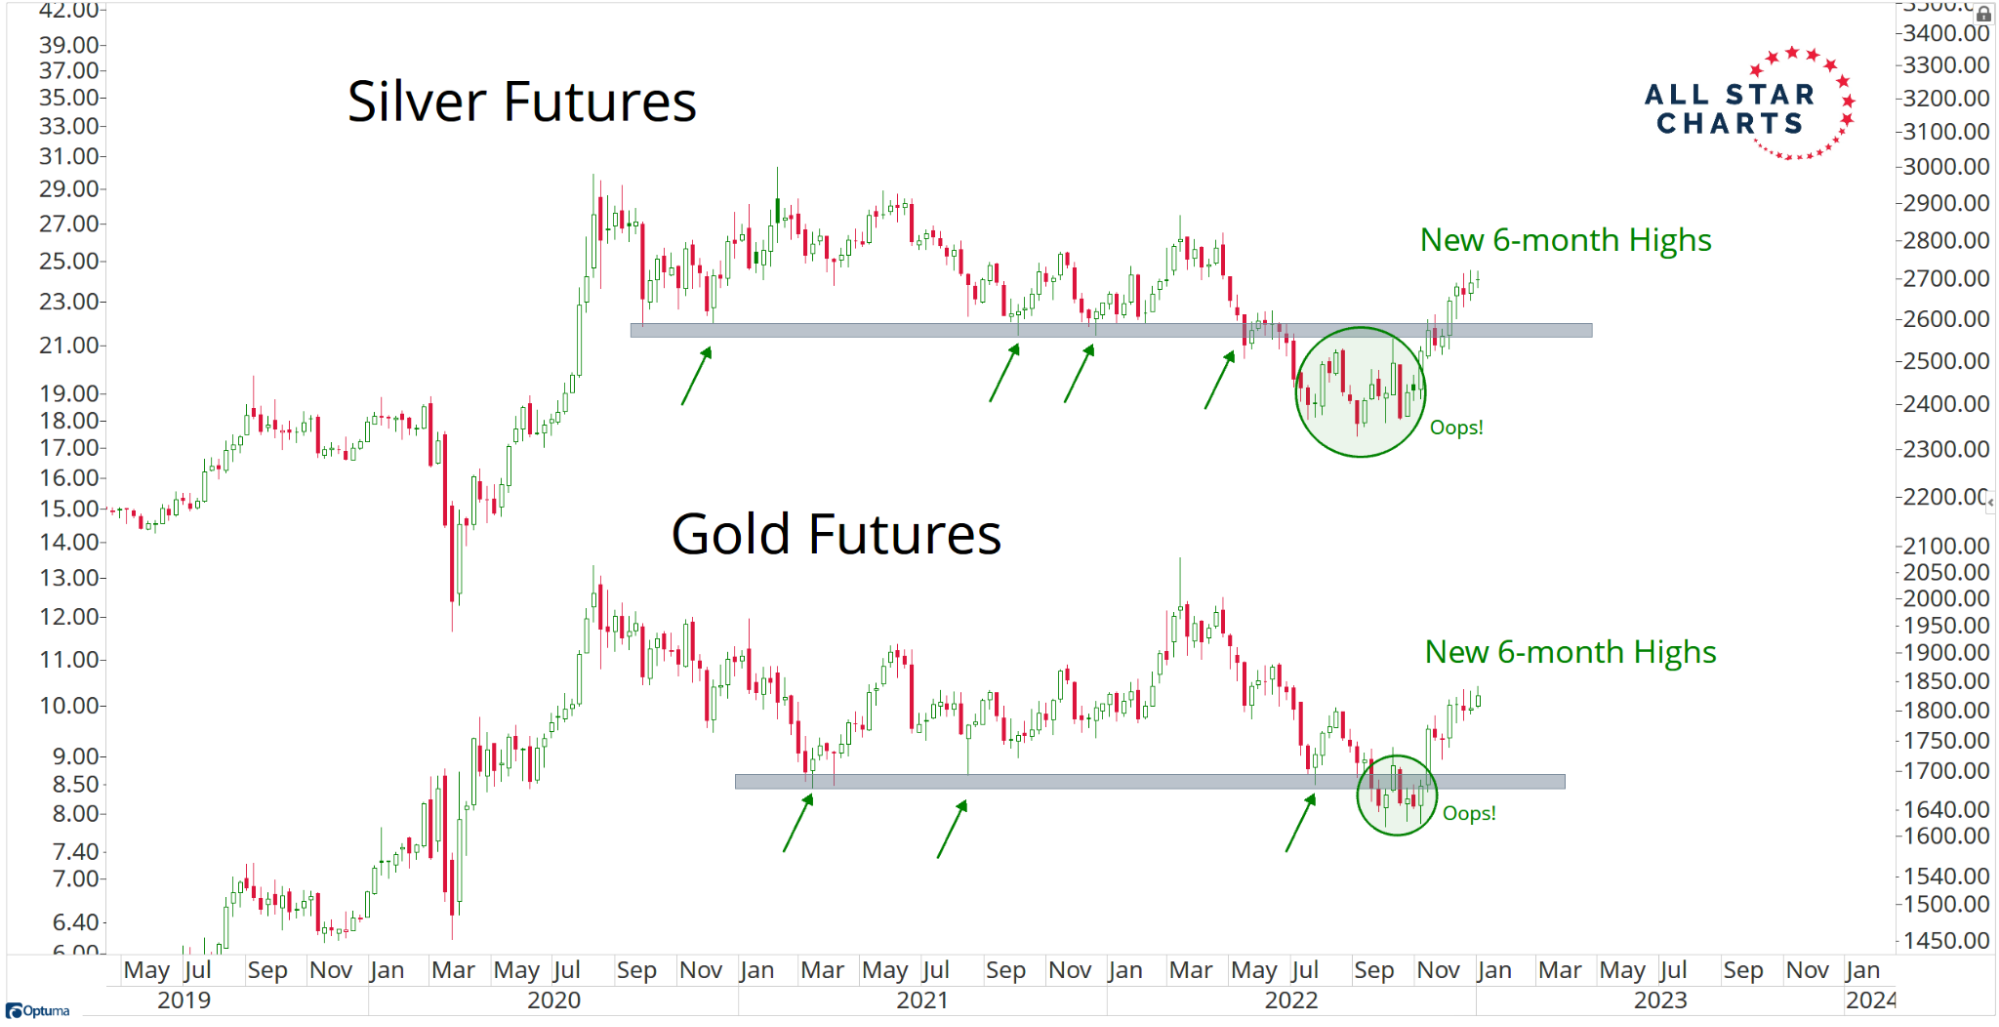
As you can see above, Gold & Silver are confirming one another by hitting 6-month highs together.

The current leg higher began a couple of months ago after both metals formed a failed breakdown at support. As you might know, failed breakdowns often lead to fast moves higher, and we're starting to see that play out.

Silver Futures Chart

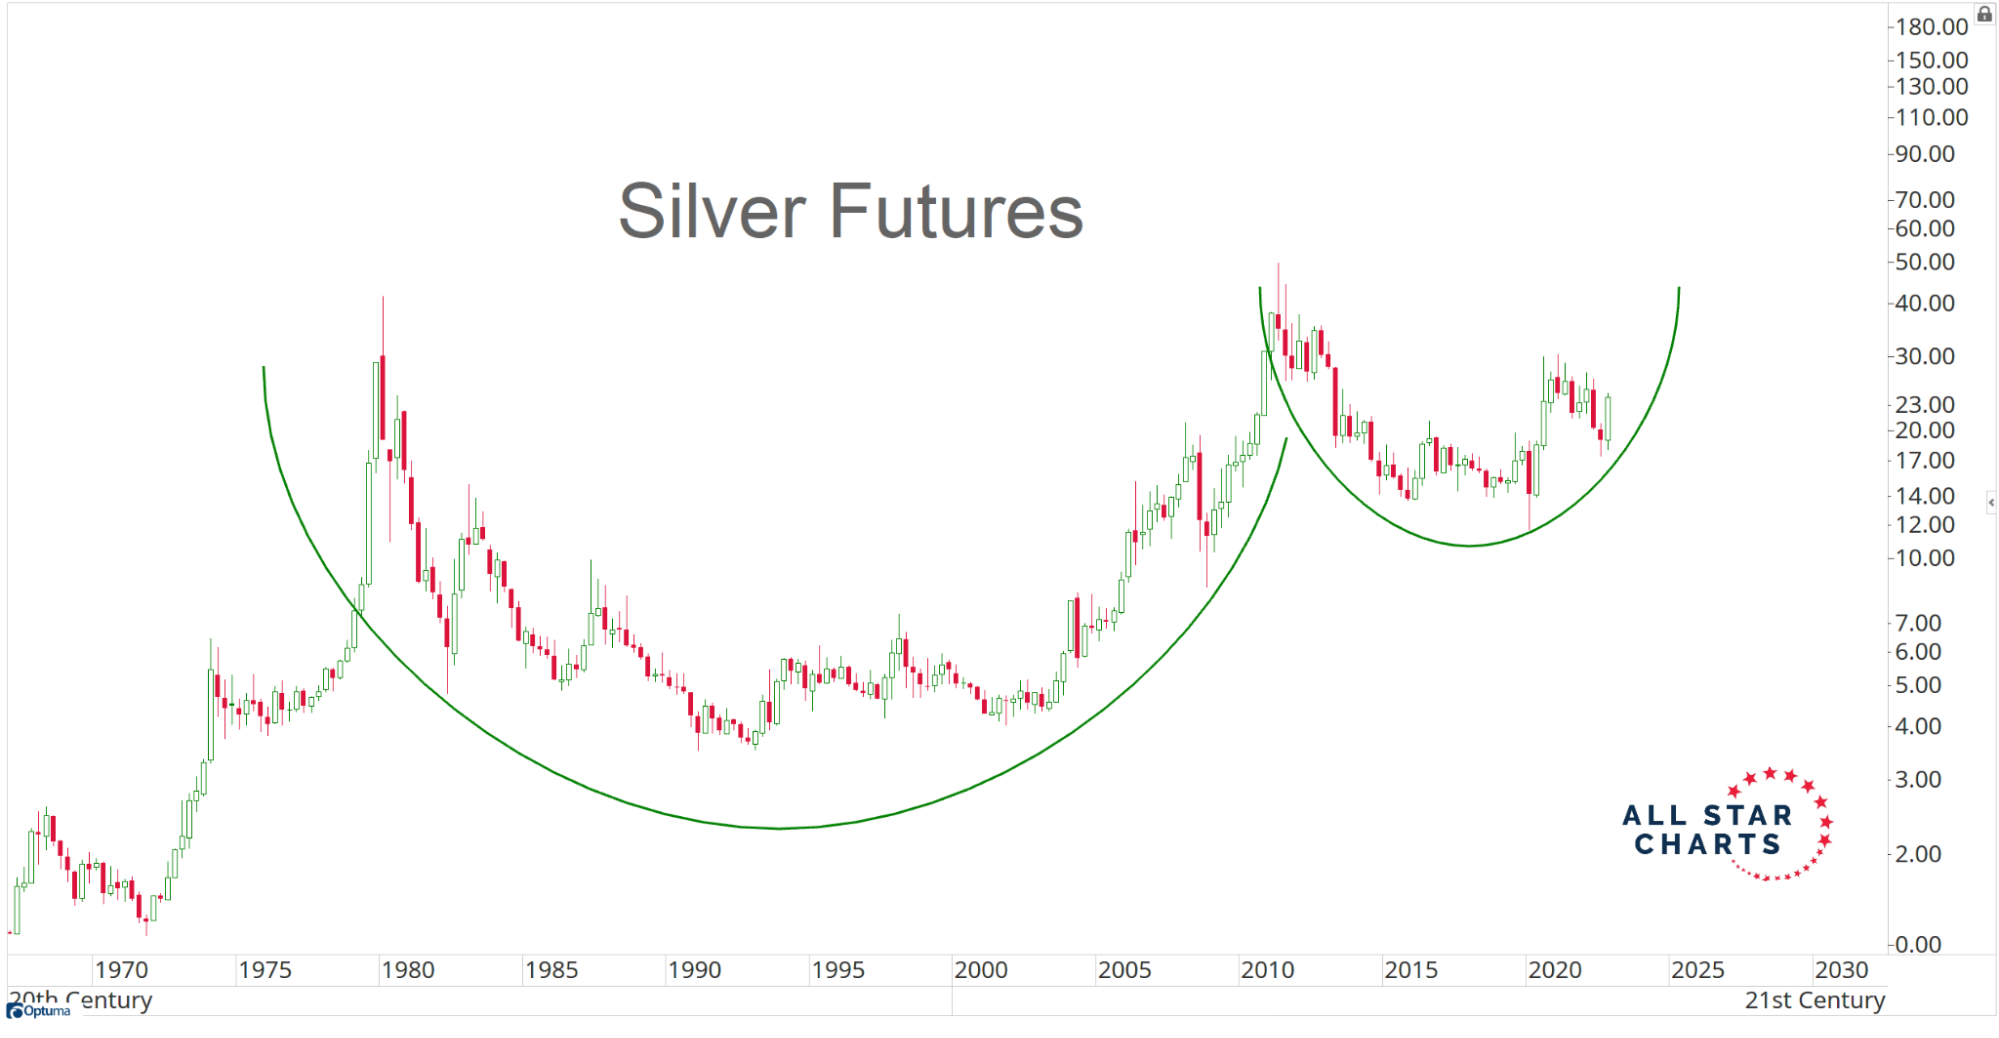
When you zoom out and look at a long-term chart of Silver, you'll notice it's in the process of forming a massive Cup & Handle pattern that dates back to 1980.

The next long-term objective for Silver is around $50, which is the all-time highs from 1980/2011. That's more than 100% higher here!

Be sure to download this free report to learn how to profit from this potentially historic move.

Enjoy,
The INO.com Team

Golden Pattern For Silver, Not Gold

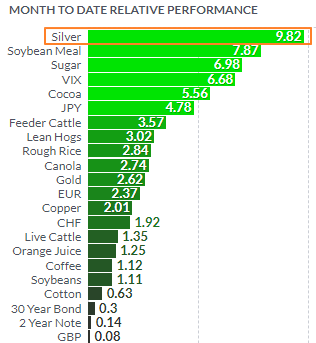
Silver futures continue to maintain leadership not only among metals, but compared to all futures as we can see in the leaderboard below.

MTD Relative Performance

Chart courtesy of finviz.com

The white metal has seen gains of close to ten percent month-to-date. None of the metals come close as copper futures, formerly the number two, has lost its shine lately as I shared the reason last week. When compared to silver futures, gold futures appear pale with gains of 2.62%.   

All last week, I observed a pattern in the making, watching to see when it would trigger. As a result, exactly at the end of last week, the expected event happened. Here is a visual representation in the daily chart below.

Silver Futures Daily Golden Cross

Source: TradingView

There are two simple moving averages in the silver daily chart above. The blue line represents a 50-day moving average and the red one is a 200-day moving average. We can see that last week the short-term blue line crossed above the long-term red line. This pattern is called a “Golden Cross”. It is a bullish sign as it indicates a change in the trend to the upside. Continue reading "Golden Pattern For Silver, Not Gold"

Poor Man's Gold Shines The Brightest

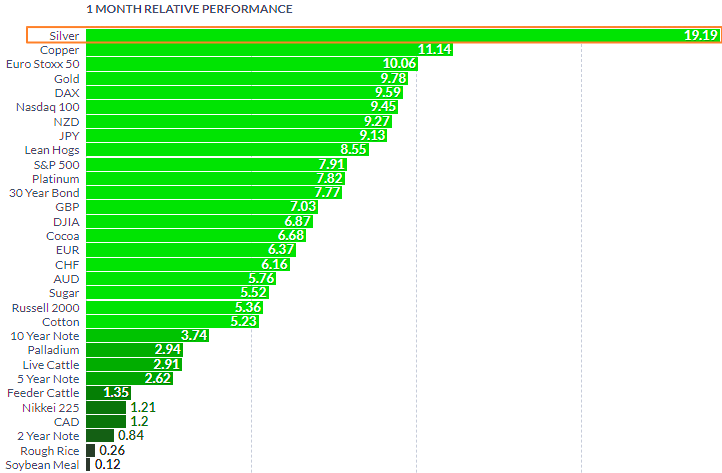
Please take a look at the graph below. These futures left their competitors far behind with a tremendous gain of almost twenty percent in only one month.

1 Month Futures Performance

Chart courtesy of finviz.com

On a one-month horizon, silver's meteoric price increase is undeniable. None of the metals can even come close. Copper is lagging eight percent behind as gold futures show only half the performance of silver. By the way, I am about to show you the relative dynamics of these top metals in the chart below.

Gold-Silver Ratio

Source: TradingView

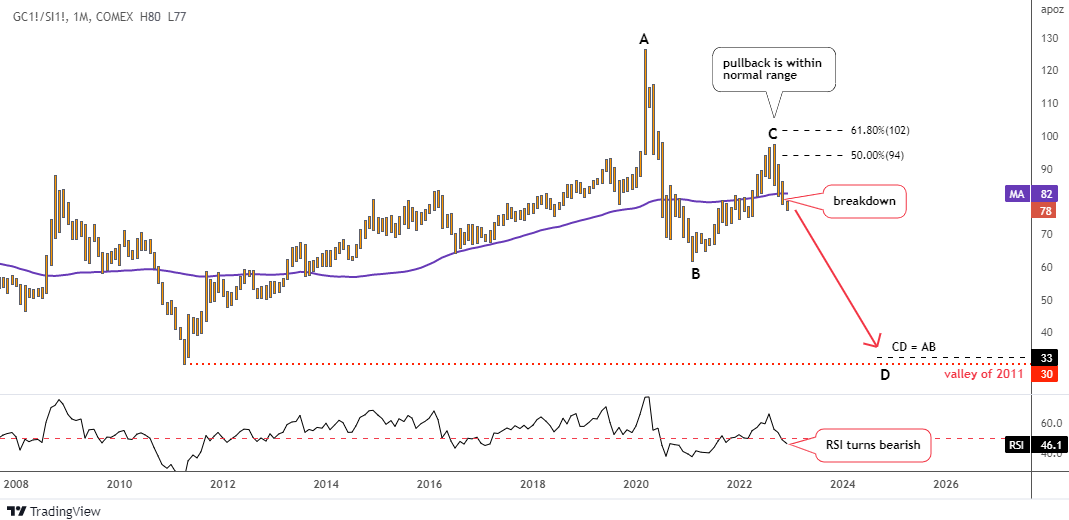
The chart above visualizes the comparative superiority of silver futures over gold futures that we revealed in the first graph. The white metal has been reversing its nine-year losses since the bottom of 2011 at 30 oz up to the all-time high at 127 oz in 2020, where the large age long cycle has been completed. Continue reading "Poor Man's Gold Shines The Brightest"

Silver And Palladium Update: False Hope

The price action in the silver futures has given a false hope to bulls this month.

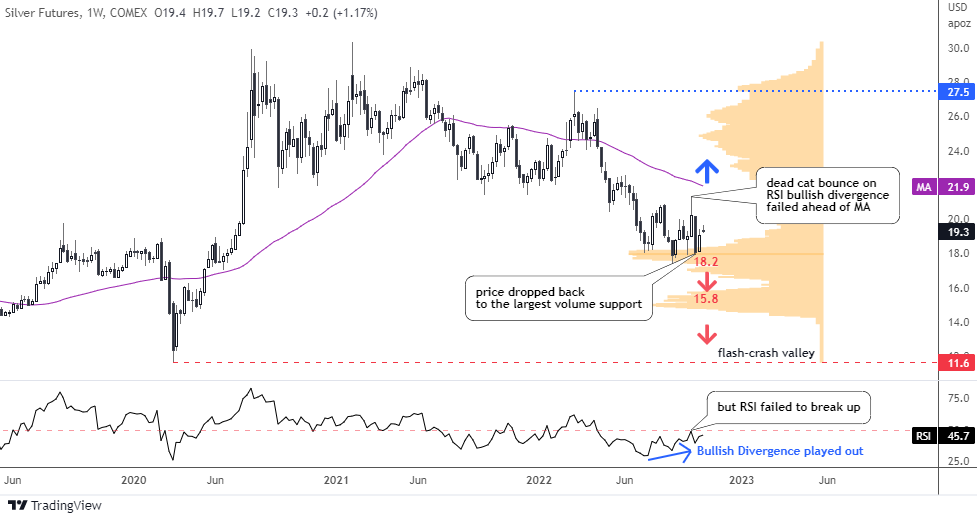
The largest volume support (orange) has offered a solid support for the silver futures price lately. It is located between $17.4 and $18.2. The price has tested it three times already and failed to break it down.

Silver Futures Weekly

Source: TradingView

The RSI has built a Bullish Divergence during the second touchdown at the end of the summer. The reaction was an imminent reversal to the upside. It was promising price action for the bulls as the futures price soared from $17.4 up to $21.3 by the start of this month to book the gain of almost four bucks (22% growth).

Afterwards, the same indicator has failed to break above the 50 barrier in spite of a strong impulse and so did the price rally. It stopped more than half dollar below the moving average (purple).

The price dropped back to the largest volume support after above mentioned failure but bounced then. It has managed to score more than one dollar from the latest valley of $18. This puts the silver futures between the hammer ($21.9, moving average resistance) and the anvil ($18, volume support).

The chart structure of the recent rally looks corrective. This means that the weakness of the price should resume. The next support is located at the following volume area of $15.8.

There are no other significant levels to catch the “falling knife” of silver except the “Flash-Crash” valley in $11.6. The drop to the latter could build a larger corrective structure visible on a bigger map.

The invalidation of the bearish outlook would come with the breakup of the moving average above $21.9.

Last time, your most popular answer was that silver futures would stop at $16. The next bid was bullish. None of the bets have played out as yet. Continue reading "Silver And Palladium Update: False Hope"