
The gold futures have skyrocketed on better than expected U.S. inflation data last week. The annual inflation rate in the U.S. slowed for a fourth month to 7.7% in October, the lowest reading since the start of a year, and well below forecasts of 8%.
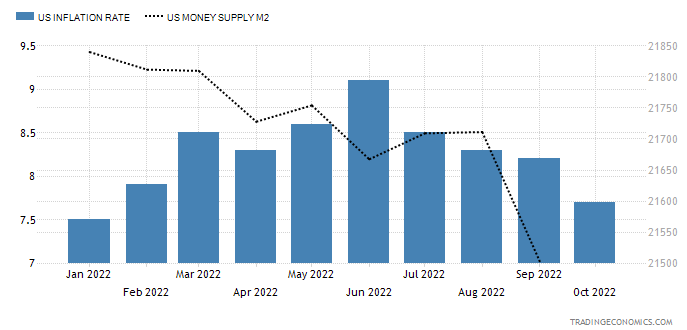
According to logic, the gold price should fall as anti-inflationary tightening measures have shown positive results in cooling price growth. The printing press, represented by the M2 money supply indicator (black dotted) in the chart above, has stopped and the reading is declining as well.
Let us check the chart below to look for an answer in the fundamental data of world gold demand.
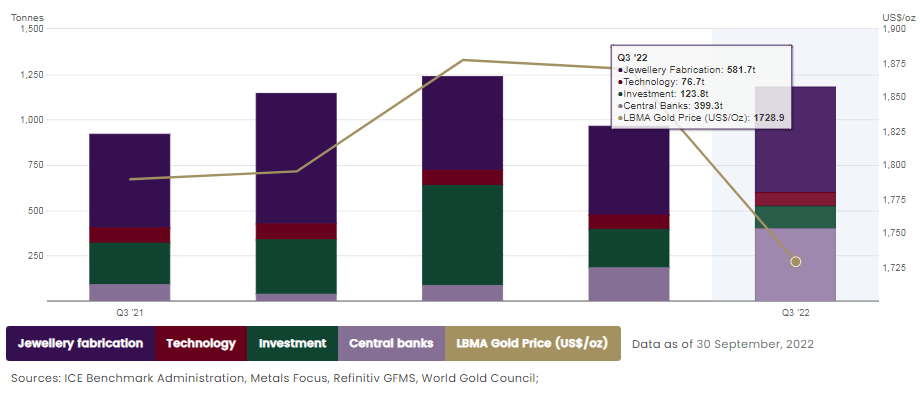
The graph above shows the quarterly data of demand statistics in the period from Q3 2021 to Q3 2022. According to the data, the most stable demand source comes from a technology side (wine-colored). The jewelry demand (dark purple) is price sensitive: it shrinks on the rising price and expands during price falls. The investment demand (dark green) is cooling down amid the tightening as per the logic I explained above.
The most interesting finding was the data of central banks’ demand (violet). In the beginning of the year, the reading was small, but it has steadily increased throughout the year until it soared in the last quarter to almost 400 tons. A huge 34% of the total demand has come from this source, up from 10% a year ago.
Indeed, central banks are the “whales” of the gold market with deep pockets. The size of purchases by central banks exceeded the reduction of investment demand between Q1 and Q3 2022.
What was the reason for this frenzied "buy on dip" activity? These things are certain - they have a different logic, a more expansive view, and a longer horizon.
Let me update the technical chart zooming out to a monthly time frame.
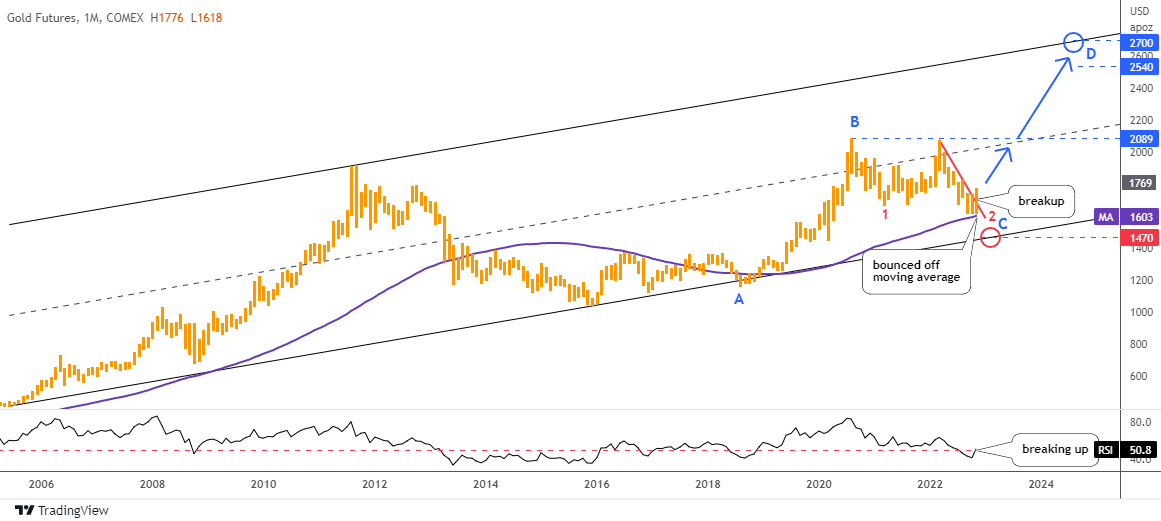
This map above was shown originally two years ago in the post titled “Gold & Silver: Too Good To Be True?”.
Following the new all-time high of $2,089 in August 2020, I predicted a two-legged correction. Frankly speaking, I did not think it could take more than two years to build it.
Red leg 2 down has traveled slightly deeper down compared to red leg 1, and the minimum criteria has been achieved. The moving average for the past five years has offered strong support around $1,600. Gold futures hit a valley of $1,618 and then rebounded.
Price has broken through the red trendline resistance past $1,700 this month. The RSI is breaking above the crucial 50 level as well.
The first upside target is located at the double resistance of the all-time high of $2,089 and the huge uptrend’s mid-channel.
The second target is at the same distance from the CD segment as the AB part, at $2,540.
The third goal is to hit the upside of the big uptrend around $2,700.
A drop below the moving average around $1,600 and further breakdown of the uptrend below $1,470 will sound the bearish alarm.
Intelligent trades!
Aibek Burabayev
INO.com Contributor
Disclosure: This contributor has no positions in any stocks mentioned in this article. This article is the opinion of the contributor themselves. The above is a matter of opinion provided for general information purposes only and is not intended as investment advice. This contributor is not receiving compensation (other than from INO.com) for their opinion.
The whales are coming to get beaten down product to have another pump and dump with a good technical basis
I WAS WAITING FOR THIS ARTICLE FOR A FEW DAYS.THANK YOU.
I ALSO HAVE A VERY SIMPLE EXPLANATION FOR THIS BULL RUN.
THE "WHALES",I CALL THEM STALKERS,NEW MAFIA OF THE FUTURE, CRIMINALS ,etc.
THEY ARE HUNTING MY SMALL HAND ACCOUNT.
REMEMBER THE SPIKE IN THE RAND FROM 17 to 19,THE SPIKE IN THE OIL TO 136,THE DROP IN THE POUND,
etc.I WAS THERE .THIS TIME WITH GOLDY LOCKS I'M IN A BIG BUY WITH EFT's AND A SELL WITH A SMALL ACC.
TRY A SMALL ACC. AND SEE YOURSELF!
Dear Mr. Calitz,
First of all, thank you for a warm feedback.
It is my pleasure to cover the topic you were waiting for.
I know what you mean, retail investors talk about it for quite some time.
Paper gold sold and physical gold is bought, this is how it used to work.
Some developed countries have been accumulating physical gold stubbornly no matter what as they have read this game either.
Thank you for sharing,
Good luck,
Aibek