
The idea behind "Dr. Copper" is that copper is a reliable barometer of economic growth, as the demand for copper tends to rise when the global economy is expanding and fall when it's contracting.
Last December, I shared my bearish outlook for copper futures titled “Fed Fears Inflation, Copper Fears Hawkish Fed”. It was based on the long term map of downward move with a current pullback playing as a junction between large 2 legs down.
The majority of readers expressed a mildly bullish stance, with the belief that the price of $3 for copper futures should hold.
The second largest group had an ultra-bearish outlook, targeting a price of $1.25 during a potential Great Recession.
Let us see in the weekly chart below the updated map.
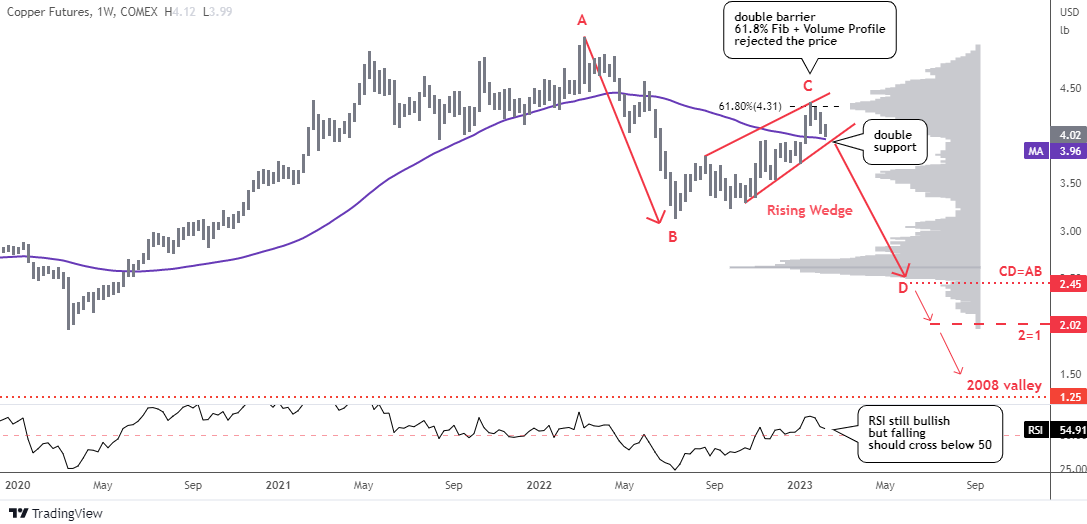
The copper futures price stalled at the same level after an earlier attempt to push below the red trendline support failed.
The most recent low in U.S. inflation data in December 2021, which was the lowest reading since October 2021, gave traders hope that the Fed was about to stop raising interest rates. This increased demand for copper, causing the price to quickly break above the purple moving average and rise until it reached the double barrier of the 61.8% Fibonacci retracement and the gray Volume Profile.
The price came down a bit failing to overcome resistance. A better-than-expected January “Jobs Report Dropped A Bombshell On The Markets” including copper futures. The market realized that the Fed would be able to raise interest rates further and larger and sold off most instruments. The meltdown of copper price accelerated.
Currently, the price has reached double support comprised of the red trendline and purple moving average. The RSI has yet to touch the crucial level but it is declining as well.
The price has formed the red Rising Wedge reversal pattern within the expected pullback. The breakdown of the trendline support would ignite further sell-off.
The C point had been set higher so I raised the D point accordingly to $2.45 where the CD is equal to the AB segment. It is located in the valley of Volume Profile’s largest support.
Usually, the market doesn’t leave former valleys untouched and we could see a deeper collapse to retest the $1.9-$2.0 area (2016, 2020 lows). The Great Recession’s bottom at $1.25 is the ultimate bearish target.
Now, let us examine the chart below answering the question, ‘Dr. Copper Prescribes Gold?’
The Gold-Copper ratio is another indicator of economic conditions because changes in the ratio can reflect changes in the relative supply and demand of the two metals, which are influenced by various economic factors.
For example, a rising gold-to-copper ratio can indicate that the demand for gold, seen as a safe-haven asset, is increasing relative to the demand for copper, which is used primarily in industrial applications. This could be a sign of increased economic uncertainty or a downturn in the global economy, as investors seek to protect their wealth through investments in gold.
The content of this chart might be sensitive and potentially hurt feelings.
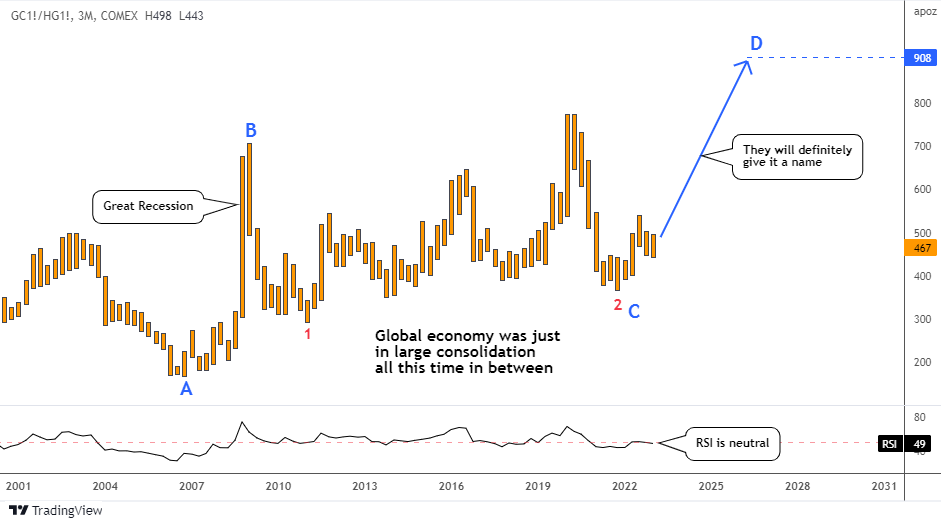
Even inexperienced observers can identify two major areas in the chart. The rally from 2006 to 2009 is marked as the AB segment. This was during the Great Recession, and the chart accurately reflects how the safety of gold became more important than the demand for copper in the economy.
The subsequent improvement in the economy led to a significant decrease in the ratio during the first downward red leg within a large consolidation between points B and C. There was a temporary rebound within this consolidation as the ratio retested the B point during the pandemic.
However, hope returned to the world as infections declined and economies reopened, leading to the downward red leg 2. It's remarkable that the size of red leg 2 perfectly matches that of red leg 1. This is the true magic of this analysis.
It appears that the global economy was in a large consolidation all the time between 2009 and 2021.
The rally that took place last year peaked in the summer and this could be just the start of the CD segment moving upwards. The D point was set at 908 ounces of copper, equal in distance to the AB segment in the CD part. The world should be prepared for another potential 'perfect storm' that could be nicknamed accordingly.
Intelligent trades!
Aibek Burabayev
INO.com Contributor
Disclosure: This contributor has no positions in any stocks mentioned in this article. This article is the opinion of the contributor themselves. The above is a matter of opinion provided for general information purposes only and is not intended as investment advice. This contributor is not receiving compensation (other than from INO.com) for their opinion.