"Dr. Copper's" Prescription Proves Effective

In February, I presented my analysis of copper and gold/copper price trends in a post titled, Dr. Copper Prescribes Gold. Now, it's time to update both charts.

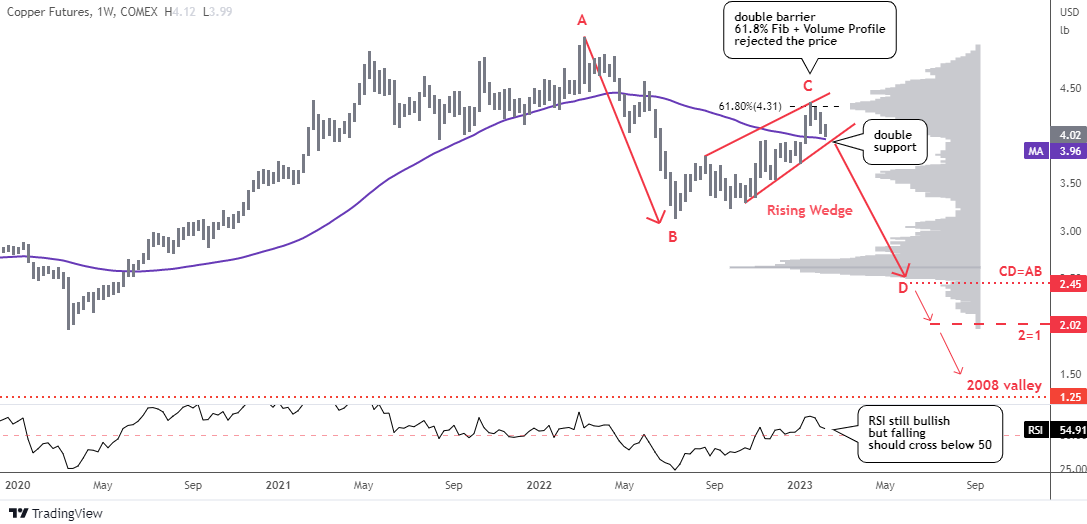
In the previous analysis, most readers preferred a conservative outlook for copper futures prices, predicting a drop to only the equal distance in the CD part, which is $2.45. Since then, the price has declined, but not as rapidly as anticipated.

Let me show you the updated copper futures chart below.

Copper Futures Weekly

Source: TradingView

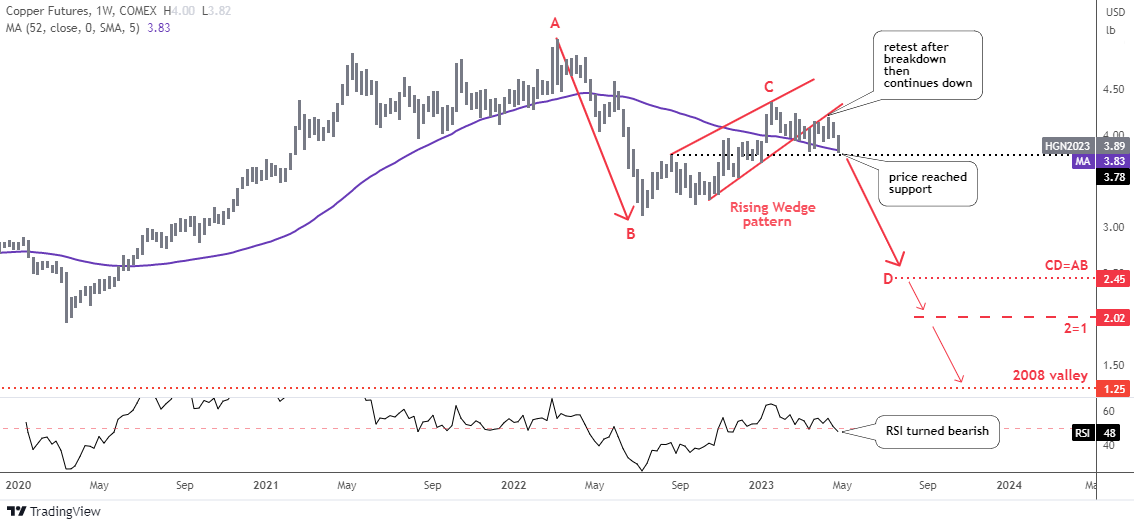
As expected, the price action on the Rising Wedge pattern's support played out in textbook fashion, with the price breaking below it and then spiking up to retest it before continuing its downward trend.

The price has now reached a double support zone formed by the purple moving average and the black horizontal trendline, between the $3.78 and $3.83 levels. Continue reading ""Dr. Copper's" Prescription Proves Effective"

"Dr. Copper" Prescribes Gold

The idea behind "Dr. Copper" is that copper is a reliable barometer of economic growth, as the demand for copper tends to rise when the global economy is expanding and fall when it's contracting.

Last December, I shared my bearish outlook for copper futures titled “Fed Fears Inflation, Copper Fears Hawkish Fed”. It was based on the long term map of downward move with a current pullback playing as a junction between large 2 legs down.

The majority of readers expressed a mildly bullish stance, with the belief that the price of $3 for copper futures should hold.

The second largest group had an ultra-bearish outlook, targeting a price of $1.25 during a potential Great Recession.

Let us see in the weekly chart below the updated map.

Copper Futures Weekly

Source: TradingView

The copper futures price stalled at the same level after an earlier attempt to push below the red trendline support failed. Continue reading ""Dr. Copper" Prescribes Gold"