
Last month, after gold had missed our primary target of $1577 and then started to collapse, I wondered if "A Bear Face Was Showing Up?". The price was still above the trendline support, although it dipped below $1500. I also spotted the potential reversal Head & Shoulders pattern, which was adding to the possible Bear Face.
Let's see below what you had been expecting from the market these days.
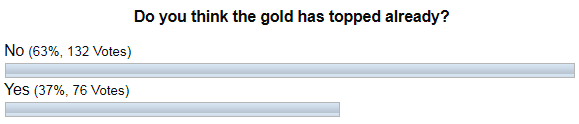
The most of your votes in the earlier ballot were for the "No" option, which means you didn't think that gold had topped already keeping bullish outlook, no matter what. The thing is that we don't know the right answer yet, as none of the triggers were pushed. To remind you, the Bearish confirmation is only below $1400, and the Bullish one is above $1557.
I want to share with you the anatomy of the failed Head & Shoulders pattern below to show what has gone wrong for educational purposes in the 4-hour chart below.
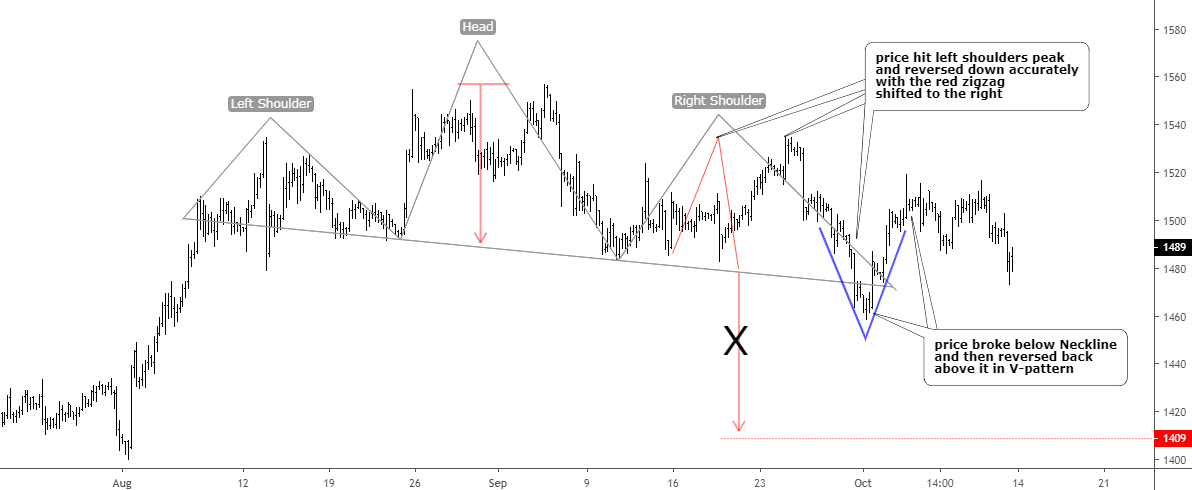
Chart courtesy of tradingview.com
There is an earlier chart above with original annotations. I just cut the brightness of the objects to focus on the new annotations.
The price of gold followed the planned path highlighted with the red zigzag as price hit the $1535 level as I forecasted this move to reach the top of the Left Shoulder, where it should then reverse to the downside. Indeed, the next drop was sharp, and it managed to break down the Neckline, although the latter was short-lived. And here we can see what went wrong then as the bounce was also sharp and it shaped the reversal V-pattern (blue). The price was brought back almost to the area where the drop had started.
The reversal Head & Shoulders pattern hasn't been invalidated as yet as the price should break up the Right Shoulder at $1535, but for me, it has failed already as it didn't emerge further below the Neckline.
I prepared for you a very detailed 4-hour chart with an updated outlook below.

Chart courtesy of tradingview.com
This is how I see the current chart structure of gold. I highlighted the crucial moves with different colors not to confuse you. I went deep into 4-hour time frame to highlight as much substantial trading information as possible as it could help you to get my viewpoint.
Let's start with red labels. This considerable drop, which tested the bulls' patience turned out to be a big consolidation. It consists of two legs as I numbered them with red digits on the chart. The second leg down has accurately hit the common 61.8% Fibonacci retracement level at $1459 on the 1st of October.
Then there was a sharp bounce up, which has shaped the V-pattern mentioned in the previous chart above. This move reached $1520, approaching the former top at $1535. It could be the first move up after the big consolidation (red). Then the followed drop could be the minor consolidation (chocolate color). It also unfolded within two legs down like the large red consolidation. This move down almost reached the deep 78.6% retracement level. The invalidation point for the potential first move up is located below the valley of red consolidation at $1459. The price should break above the apex of the first move up beyond $1520 to continue the growth.
To find the target, I applied the AB/CD concept with blue annotations. The CD segment should reach $1616 to be equal to AB segment. This target is well above our long-awaited $1577 level.
The risk/reward ratio is 1:4.30 based on Friday's close at $1487, which is quite healthy. The stop should be set not far below $1459. Conservative traders could wait for the breakout above $1520, then the risk/reward ratio will be 1:1.94 based on the stop below $1474 (minor consolidation), which is not so bad either.
Intelligent trades!
Aibek Burabayev
INO.com Contributor, Metals
Disclosure: This contributor has no positions in any stocks mentioned in this article. This article is the opinion of the contributor themselves. The above is a matter of opinion provided for general information purposes only and is not intended as investment advice. This contributor is not receiving compensation (other than from INO.com) for their opinion.
Gold will go up and down, always has, always will.,buy a position and wait. It’s coming.
According to one trading buff, "This markets made of bullish stuff. The shorts who,ve had it very rough will cover couse they had enough. Buy all you can'e en on the cuff." But claims an analytical lad, with facts and figures on his pad; "Damand is down. And that,s real bad. Supply is up, that's also sad. To pay this this price you must be mad.'' Which leaves me where I started from ,not very bright and feeling glum. Perhaps it would be far less dumb. If to their brains I not succumb, instead let mine be venturesome. I'll bet that if a chart could speak it would most likely say,'' I think man must be quite a freak, to opt such childish play,'' It,s sad that bulls and bears make dough but pigs just never do. Yet who will tell us where to draw the line between the two? They also say to buy when weak and sell on show of strength. Again, who'll tell us how to gauge a actions likely length ? I have this framed on my desk to remember that I always make money sitting with positions, for long extended periods of time, adding positions letting the market tell me when trend changes are occurring. use Exhaustion Gaps,
Above 1520 IS GO:
I am irritated that the 3rd October spike went higher than the one on Oct.10......
The Bear has not disappeared to my opinion!
I wish I could vote gold prices higher.