
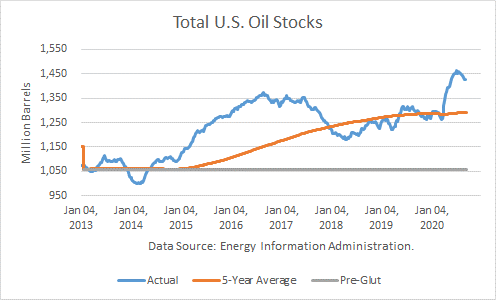
According to the Energy Information Administration, U.S. petroleum inventories (excluding SPR) fell by 7.5 million barrels last week to 1.422 billion, and SPR stocks dropped by 0.8 million barrels. Total stocks stand 128 mmb above the rising, rolling 5-year average and about 128 mmb higher than a year ago. Comparing total inventories to the pre-glut average (end-2014), stocks are 363 mmb above that average.
Crude Production
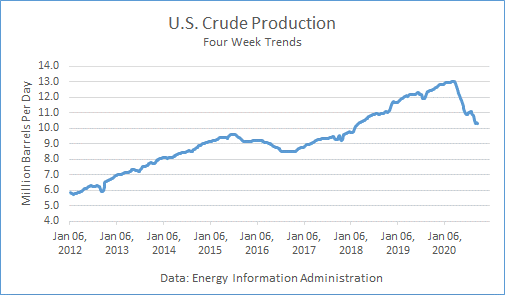
Production averaged 10.7 mmbd last week, off 200,000 mb/d from the prior week. It averaged 10.325 mmbd over the past 4 weeks, off 16.9 % v. a year ago. In the year-to-date, crude production averaged 11.766 mmbd, off 3.2 % v. last year, about 400,000 b/d lower.
Other Supply
I have previously noted in an article how the “Other Supply,” primarily natural gas liquids and renewables, are integral to petroleum supply. The EIA reported that it fell by 28,000 b/d v. last week at 6.975 mmbd. The 4-week trend in “Other Supply” averaged 6.886 mmbd, off 1.9 % over the same weeks last year. In YTD, they are off 0.4% from 2019.
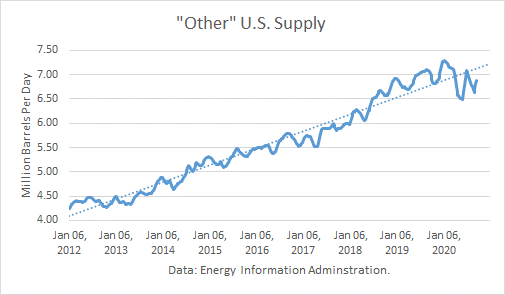
Crude production plus other supplies averaged 17.211 mmbd over the past 4 weeks, far below the all-time-high record of 20.213 mmbd.
Crude Imports
Total crude imports rose by 160,000 mb/d last week to average 5.168 mmbd last week. This figure was above the 4-week trend of 5.125 mmbd, which in turn was off 24.2 % from a year ago.
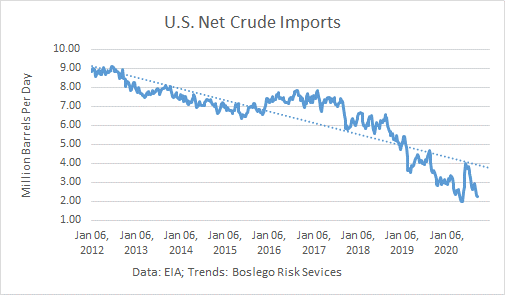
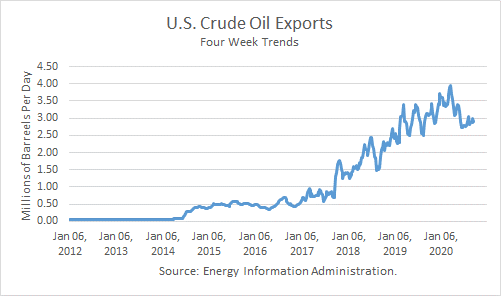
Net crude imports fell by 267,000 b/d because exports rose by 427,000 b/d to average 3.022 mmbd. Over the past 4 weeks, crude exports averaged 2.891 mmbd, 7.6 % lower than a year ago.
U.S. crude imports from Saudi Arabia fell by 26,000 last week to average 304,000 b/d. Over the past 4 weeks, Saudi imports have averaged 233,000 b/d, down 45.3 % from a year ago.
Crude imports from Canada fell by 125,000 b/d last week, averaging 2.932 mmbd. Imports over the past 4 weeks averaged 3.060 mmbd, off 12.4 % v. a year ago.
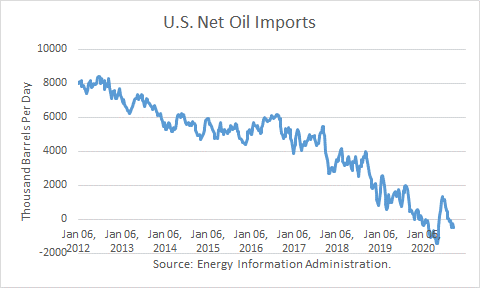
Net oil exports averaged 481,000 b/d over the past 4 weeks. That compares to net oil imports of 569,000 mb/d over the same weeks last year.
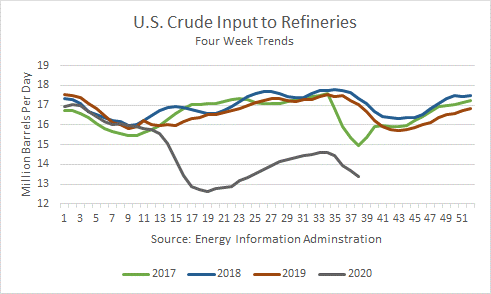
Crude Inputs to Refineries
Inputs fell by 119,000 b/d last week last week, averaging 13.370 mmbd. Over the past 4 weeks, crude inputs averaged 13.376 mmbd, off 21.4 % v. a year ago. In the year-to-date, inputs averaged 14.409 mmbd, off 13.9 % v. a year ago.
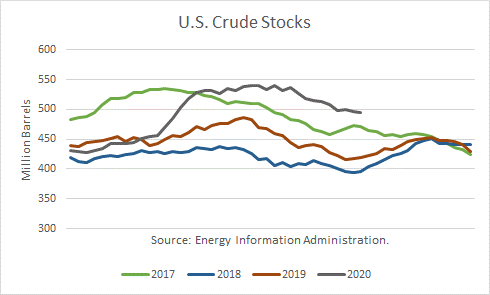
Crude Stocks
Over the past 4 weeks, crude oil demand exceeded supply by 638,000 mb/d.
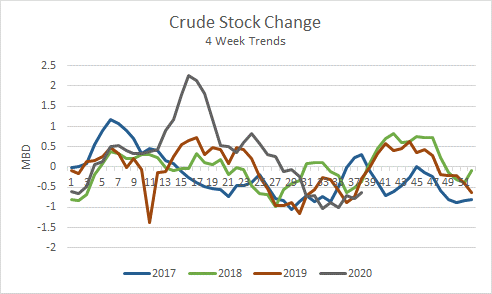
Commercial crude stocks 495 mmb are now 74.9 million barrels higher than a year ago.
Petroleum Products
Given the recent net product stock draws, product demand has exceeded supply by 36,000 b/d.
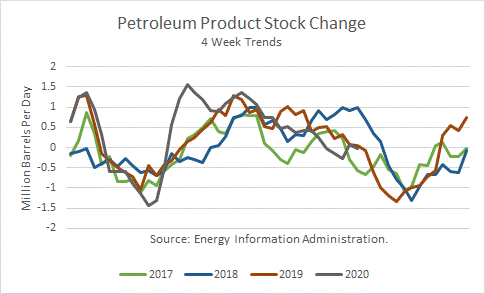
Total U.S. petroleum product stocks at 927 mmb are 49 million barrels higher than a year ago.

Product exports rose by 558,000 mmb/d last week, averaging 4.973 mmbd. The 4-week trend of 4.675 mmbd is off 9.3 % from a year ago. In the year-to-date, exports averaged 5.009 mmbd, off 1.9 % from a year ago.
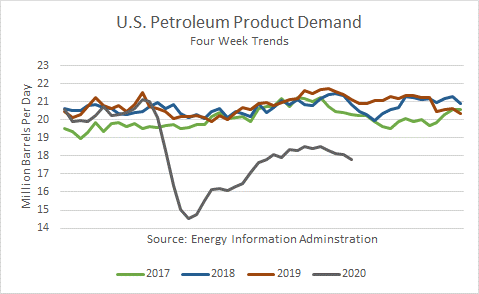
Demand
Total petroleum demand averaged 17.781 over the past 4 weeks, off 15.9 % v. last year. In the YTD, product demand averaged 18.123 mmbd, off 12.8 % v. the same period in 2019.
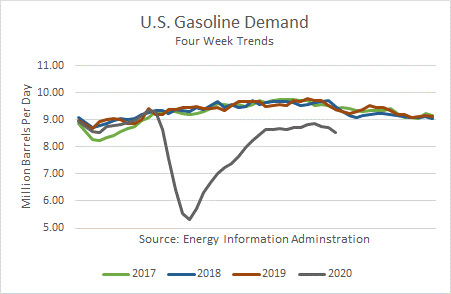
Gasoline demand at the primary stock level rose by 37,000 b/d last week and averaged 8.542 mmbd over the past 4 weeks, off 9.0 % v. the same weeks last year. In the YTD, it reported that gas demand is off 13.6 % v. a year ago.
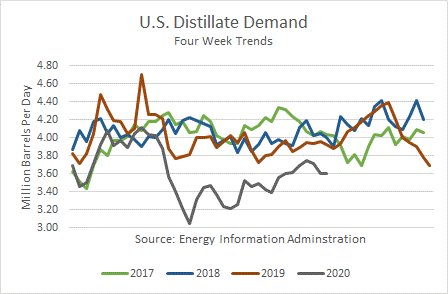
Distillate fuel demand, which includes diesel fuel and heating oil, rose by 1.150 mmb/d last week, and averaged 3.600 mmbd over the past 4 weeks, off 8.2 % the same weeks last year. In the YTD, demand is off 9.7 % v. a year ago.
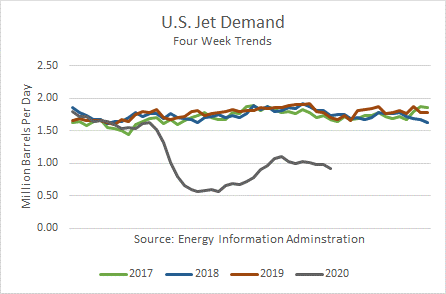
Jet fuel demand is off 45.8 % over the past 4 weeks v. last year. In the year-to-date, demand was off 39.6 % v. 2019.
Product Stocks
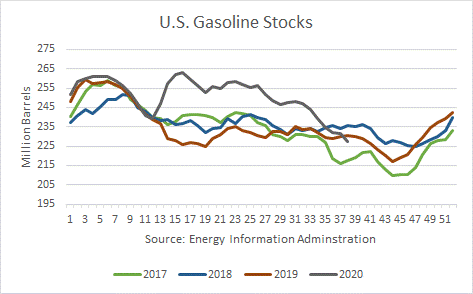
Gasoline stocks are now 2.7 mmb lower than a year ago, ending at 227.5 mmb.
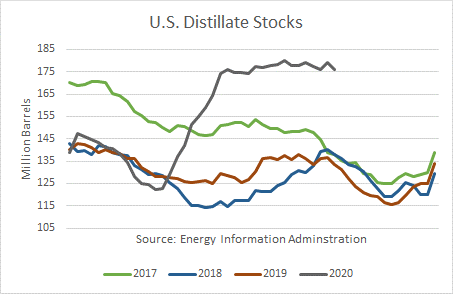
Distillate stocks are 42.3 mmb higher than a year ago, ending at 175.9 mmb.
Conclusions
Total petroleum stocks have been correcting lower, but the pace has been much slower than the build-up. The recovery in both crude oil and product demand trends has not only stalled but is reversing.
The only bright spot is gasoline inventories. They are actually slightly lower than they were last year, but that is strictly due to lower supply because the demand trend is 9 % lower than it was last year.
Check back to see my next post!
Best,
Robert Boslego
INO.com Contributor - Energies
Disclosure: This contributor does not own any stocks mentioned in this article. This article is the opinion of the contributor themselves. The above is a matter of opinion provided for general information purposes only and is not intended as investment advice. This contributor is not receiving compensation (other than from INO.com) for their opinion.